-
 By its very nature, the shift to Product Funding is going to require that tracking of that funding. Agile tools do not have much, if any, financial capabilities, so it is important to create an eco-system that can support this value stream—from funding, through delivery, and finally to tracking the realization of financial value. Learn how Rally and Clarity PPM do this very well together.
 -
 This portlet displays the % allocation of resources to projects. The portlet shows if the resource is allocated to the projects as an individual resource or as part of an Agile team, in which case it will display the resource % allocation to the team and what that will represent in terms of % allocation to the project. The Total Allocation % display the allocation of the resource to all investments is allocated to. Remaining Capacity and Over/Under columns will help identify the resources that still have availability and the ones that are over allocated.
 -

This portlet displays the monthly allocation per resource. The PM can view by the RM or the resource to get the data for monthly resource allocations. The table below describes the available filter fields in the portlet. Column Label Description Work Effort Manager Manager of the Investment the Work Effort is on Work Effort Active Active status of the Investment the Work Effort is on Resource Resource’s Name Internal Resource ID Resource’s ID Zero Allocation Show Allocations that equal zero Open for Time Entry Is the Resource Open for Time Entry Resource Active Resource’s Active status Role Resource’s Primary Role OBS Unit Resource’s OBS Start Allocation Start Time to filter by End Allocation Finish time to filter by -
 Part of the Business Transformation collection, this bar-chart portlet displays investments and (if exists) any child investments, which are at risk with regard to the schedule of the investments.
 -
 Funnel Chart displays aggregated counts of Ideas by “Idea Progress”, a custom attribute. Chart shows Idea Progress names in legend, and count total is available as a mouse-over. No filters available on this portlet.
 -
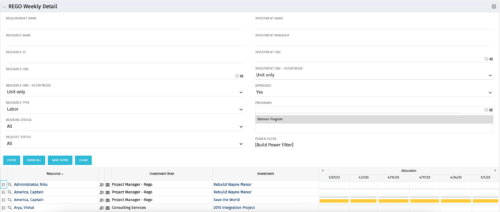 This is the same portlet as the out of the box Weekly Detail with an additional filter element for Program (multiple select). Portlet displays resource allocations graphically for each project in the specified program(s), for the next six weekly periods. Portlet filterable by numerous project, resource, and assignment attributes. Graphical representation shows Resource Availability Threshold and Allocation in hours, as a mouse-over.
 -
 The Dashboard: Project Information portlet gives a set of high-level information about the project. The portlet will pull the "id" from the page it is placed on, so this portlet is usually placed on the project dashboard tab. The portlet displays the name, project ID, project manager, description, start date, finish date, baseline start, and baseline finish.
 -
 The Dashboard: Project Status Single-line portlet gives an overview of the project overall status as well as the status indicators on the "current" status report object. The portlet will pull the "id" from the page it is placed on, so this portlet is usually placed on the project dashboard tab. This portlet displays the report date, symbols relating to the overall status, scope, schedule, cost/effort, and the overall explanation across a single line in the portlet.
 -
 Have you considered using Rally in conjunction with Clarity? Have you seen or heard about the OOTB connector? This class will go through the OOTB connector in detail and show how Rego has built our ad-on to enhance the connectivity between these two tools.
 -
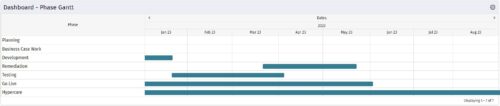 The Dashboard: Phase Gantt portlet gives an overview of all WBS level 1 tasks or milestones for a single project. The portlet will pull the "id" from the page it is placed on, so this portlet is usually placed on the project dashboard tab. The portlet displays the name, and a graphical representation of the timeline for the phases. The date range may be configured by day, month, year, or quarter. The start date may also be configured to any date or a relative date (start of current month, start of next year, etc).
 -
 In this session you’ll hear about how Hershey’s is using Clarity and Rally to plan and manage their work in a hybrid project management environment. Some of the key capabilities used in both tools will be covered and you’ll hear about their integration approach.
 -
 This training document is a Rego Consulting Quick Reference Guide to assist with creation and management of resource Teams in Clarity’s Modern User Experience. This doc references version 16.1 views. Document provides detail on how to create Teams and add resources to a Team. Instructions are provided on how to add resources by OBS and how to allocate a team to an investment. Team key points are provided with regard to Classic, Allocations, ETC and Financials.
 -
 A presentation slide deck from Rego University 2022. The document reviews creating views and using Apps in Rally. Then digs into creation of Dashboards.
- Refresh on Creating View and Using Apps
- Introduction to Concepts of Dashboards
- Configuring Dashboards & Apps
- Patterns of Useful Dashboards
- Dashboard Patterns
- Examples
- Exercise: Lets create a Dashboard
-
 The Auto-Approve Old Timesheets workflow process can be run through the "Execute a Process" job and may be used to quickly close out timesheets for a specified timeframe for period closure. The workflow will execute a query that will automatically approve ALL (no matter the status of the timesheet) timesheets that have a time period start date before the Approve Date specified within the process itself.
 -
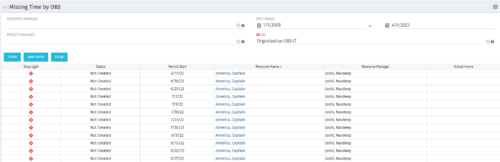 The Missing Time by OBS portlet displays all missing or late timesheets for resources staffed within a specific OBS. Resources will be included if they are open for time entry, have the track mode of ‘Clarity’ and have a timesheet that is not posted. The portlet accommodates for hire and termination dates. Also, the portlet only shows resources that the active user has the security rights to view. Administrators and the Project Management Office may use this portlet to determine the timesheet status of all resources within a specific OBS in open time periods. This portlet allows a user to quickly search by OBS and view all timesheets under that area. After selecting the OBS, the user can also filter on time period start date, Resource Manager and/or Project Manager. The portlet will display a ‘Stop Light’ indicator based on timesheet status, the status, period start, Resource Name, Resource Manager and any actual hours entered for the timesheet.
 -
 The Executive Dashboard portlet displays information regarding projects the user has security rights to view. It provides a one-stop place for the PMO or management to view all critical information about projects. The portlet not only displays status indicators as well as dates for late items, variances and days late, but also displays the project status fields from the Status Report sub-object.
 -
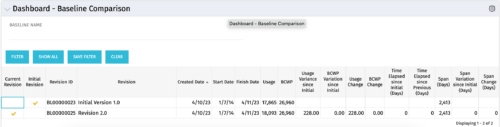 The Dashboard: Baseline Comparison portlet compares multiple baselines on a single project. The portlet is added to the dashboard page of a project and will pull in both baselines for that project and perform a comparison between the two. This portlet provides a quick way for project managers to view the differences between their baselines, especially if they have multiple members updating the project.
 -
The Dashboard: Baseline Comparison portlet compares multiple baselines on a single project. The portlet is added to the dashboard page of a project and will pull in both baselines for that project and perform a comparison between the two. This portlet provides a quick way for project managers to view the differences between their baselines, especially if they have multiple members updating the project.
-
 The Capacity Graph - Investment portlet displays Availability, Allocations, Assignments and Actuals for active resources in a single project. This portlet pulls from timeslices and allows the user to filter on weekly, monthly, or quarterly data. This portlet provides a Project Manager with a simple way to analyse: Allocations vs. Actuals and Allocations vs. ETC. Depending on metric goals, the graph allows the user to determine where areas of improvement may exist.
 -
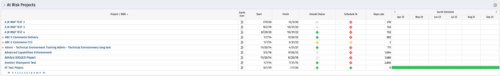
 The All Risks portlet displays all risks related to active projects that the logged in user has view rights to access. The portlet provides the project manager a single place to view risks across multiple projects without having to go into each project individually, and allows for more efficient management and reporting across projects. The portlet displays Project ID, Project, Risk ID, Risk, Category, Assigned to, Status, Probability, Impact, Priority, Target Resolution Date, and Days opened. The filter allows narrowing down of the risks by several different criteria. Note: Only the projects that the user has viewer rights to see will show up in the list.
 -
 The All Issues portlet displays all Issues related to active projects that the logged in user has view rights to. The portlet provides the project manager a single place to view issues across multiple projects without having to go into each project individually, and allows for more efficient management and reporting across projects. The filter then allows the user to narrow their search by Issue ID, Issue Name, Project ID, Project Name, the individual to whom the issue is assigned, and Issue Status. You may also narrow the view to display issues with a target resolution date within a certain date range, or Issues associated with a particular Category or OBS unit. Note: Only the projects that the user has viewer rights to will show up in the list.
 -
 The All Assignments portlet displays resource assignments across multiple projects. Currently, assignment information displayed for the project, in OWB, or MSP is limited to a single project. This portlet will provide a single view of the assigned data for all assignments across multiple projects. The portlet displays project actuals and estimates from the project (datamart tables). The Days Late field is calculated by the baseline date, while the Days Old field is calculated by today's date. Note: Only the projects that the user has viewer rights to will show up in the list. Filters provide the PM, RM, and individual resource the ability to monitor work progress across multiple projects. For example: ~ PMs can filter for all assignments that were to be completed by a given date but still have "Started" or "Not Started" status. ~ If multiple projects are utilizing the same resource, the PM or RM can filter for assignments utilizing that specific resource to prevent over-utilization. ~ A resource may filter for all assignments assigned to them, providing a picture of their total body of work.
 -
The All Assignments portlet displays resource assignments across multiple projects. Currently, assignment information displayed for the project, in OWB, or MSP is limited to a single project. This portlet will provide a single view of the assigned data for all assignments across multiple projects. The portlet displays project actuals and estimates from the project (datamart tables). The Days Late field is calculated by the baseline date, while the Days Old field is calculated by today's date. Note: Only the projects that the user has viewer rights to will show up in the list. Filters provide the PM, RM, and individual resource the ability to monitor work progress across multiple projects. For example: ~ PMs can filter for all assignments that were to be completed by a given date but still have "Started" or "Not Started" status. ~ If multiple projects are utilizing the same resource, the PM or RM can filter for assignments utilizing that specific resource to prevent over-utilization. ~ A resource may filter for all assignments assigned to them, providing a picture of their total body of work.
-
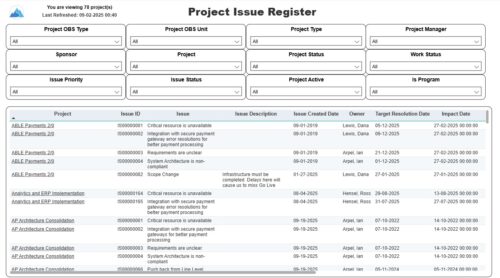 The Project Issue Register report displays comprehensive information for each project issue. The issue register also provides the option to display items that are associated to the issue such as notes, action items, and tasks. Report Prerequisites Verify that you have completed the following prerequisites before you run this report: • The project must have at least one issue for the project to display in the report. • The issue properties must have fields such as description, category, resolution, target resolution, impact date, and originating ID completed for them to display data in the report. The issue name, issue ID, priority, status, and owner are required in Classic PPM so they always display data.
 -
 Aligning work to organizational strategy is a fundamental requirement in today's ever-changing marketplace. High performing organizations are moving beyond basic connections to introduce strategic hierarchies that are tied to real measurements of business value via Clarity's Objectives and Key Results (OKRs). Join our expert guides as they present key concepts, best practices, and the evolution of strategic alignment.
 -
 Value Stream Management (VSM) isn’t just another buzzword; it’s the visibility layer your digital transformation is starving for. In this session, learn how to map, measure, and maximize value across the entire delivery lifecycle.
 -
 Struggling to use an external scheduler like MS Project or Smartsheet with Clarity or investigating its potential? Learn how to effectively use these tools with Clarity in this training, which includes best practices and lessons learned. We will show both OOTB and Rego build connectors that will make the bidirectional connections seamless.
 -
 The Project Risk Register report provides visibility into project risks, including detailed information on each risk and its associated items such as notes, action items, tasks, and related risks or issues. Results can be grouped by project or viewed without grouping to support flexible analysis. Interactive visuals make it easy to track, monitor, and manage risks across projects.
 -
 London Stock Exchange shares their Clarity journey (since 2008) and where they want to take the tool next. Current goals are: • Moving toward standardized ways of working. Focused on connecting our ecosystem of tools with Clarity as a focal point for Portfolio Management and SPM. • With an end goal of Faster Time to Market, on a journey to be a Customer Lead organization.
 -
 The movement from managing technology organizations and development by Products instead of Projects has grown in recent years. This has many advantages, but only if there are critical changes in defining and funding the development. First, we shift from defining specific solutions to developing and defining the outcomes we want to accomplish with that development. Second, we should rethink how we fund development. Instead of funding a specific scope of work, we should fund the capacity to develop products.
 -
 PMOs/EPMOs are feeling some pressure from Agile disruptors in their organizations. Some Agile purists insist that they can do everything with an Agile tool and no PMO governance, but this really isn’t the case. If you belong to a PMO or EPMO, this session will help you to better collaborate with your Agile counterparts in finding better and more holistic solutions to value delivery.
 -
This training document is a Rego Consulting Quick Reference Guide to assist with population of project properties in Clarity’s Modern User Experience. This doc references version 16.2.1 views. Doc covers Project Tiles View, Project Properties – Details page and updating from the Project List view.
-
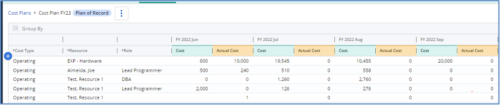
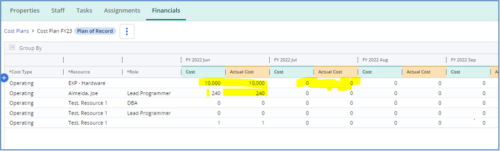 The Populate Prior Periods Forecast From Actuals in Cost Plans process updates Cost Plans for Active Projects, it updates the Forecast for previous months = Posted Actuals, to remove variances from past periods. This is an On Demand process in Clarity named Populate Prior Periods Forecast From Actuals in Cost Plans and can be manually executed from the Organizer or scheduled through the “Execute a Process” job. If there are number of processes in the Organizer – Available Processes, this process can be filtered and then checked to Start. When the process is started it will be seen in the Initiated on the Processes tab. The process status can be monitored from Running to the Completed stage. The process is very flexible and supports Cost Plans with any given grouping and it also works without any dependency on timeslices or other jobs. The process fetches Cost plan of records for all active projects in the system that have Actuals transactions in WIP table. It then process those cost plans to update all of the prior monthly forecast periods with the corresponding monthly Actuals.
 -
The Populate Prior Periods Forecast From Actuals in Cost Plans process updates Cost Plans for Active Projects, it updates the Forecast for previous months = Posted Actuals, to remove variances from past periods. This is an On Demand process in Clarity named Populate Prior Periods Forecast From Actuals in Cost Plans and can be manually executed from the Organizer or scheduled through the “Execute a Process” job. If there are number of processes in the Organizer – Available Processes, this process can be filtered and then checked to Start. When the process is started it will be seen in the Initiated on the Processes tab. The process status can be monitored from Running to the Completed stage. The process is very flexible and supports Cost Plans with any given grouping and it also works without any dependency on timeslices or other jobs. The process fetches Cost plan of records for all active projects in the system that have Actuals transactions in WIP table. It then process those cost plans to update all of the prior monthly forecast periods with the corresponding monthly Actuals.
-
 Many organizations are moving from a waterfall development approach toward agile methodologies and frameworks. This transformation impacts the financial structure of IT and can create changes in the way the TBM model needs to be built. In this session we will give a high-level overview of what an Agile Business Operating Model is and the potential impacts it could have so you can understand how to integrate this into your TBM practice.
 -
 Agile is here to stay, but waterfall may be as well. Companies around the world struggle with living in a bimodal development world, while trying to go through an agile transformation. This session will discuss best practices and lessons learned within companies that have gone through agile transformations. We will also review SAFe as a potential approach.


Copyright 2023 • Rego Consulting Corporation • Privacy Policy