-
 A Quick Reference Guide to assist in the creation of a Project Status Report in Clarity. The document uses screen shots from the Classic UX with the Phoenix theme.
 -
 This training document is a Rego Consulting Quick Reference Guide to assist with creation of agreements in Clarity’s Modern User Experience. Agreements can be created between Project, Ideas and Custom Investments. The Agreement can convey things needed for predecessors and successors while defining appropriate dates to meet the agreement. Blueprints can be leveraged to customize the agreements as required.
 -
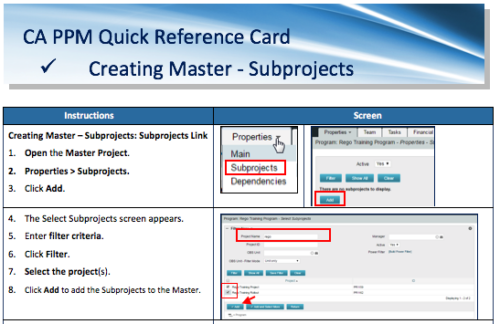 A Quick Reference Card to assist in the creation of Master-Subprojects in CA PPM.
 -
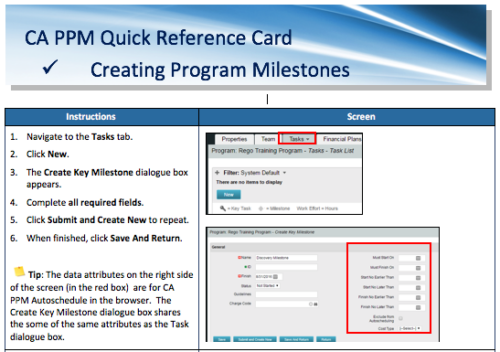 A Quick Reference Card to assist in the creation of Program Milestones in CA PPM. This can be done from the Tasks Tab or from the CA PPM Gantt.
 -
 A Quick Reference Guide to assist in creating a project from a template in Clarity’s Classic UX. Document uses screen shots to walk through the process. Document uses the Phoenix Theme.
 -
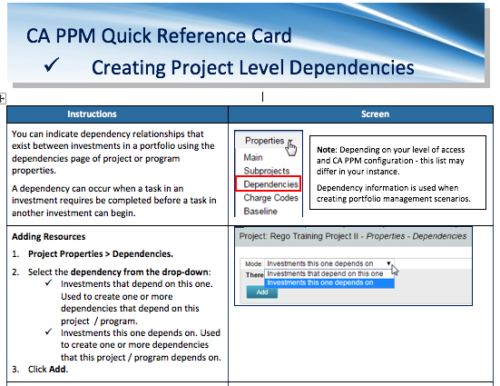 A Quick Reference Card to assist in the creation of project level dependencies. You can create dependency relationships that exist between investments in a portfolio using the dependencies page of project or program properties. A dependency can occur when a task in an investment requires to be completed before a task in another investment can begin.
 -
 This training document is a Rego Consulting Quick Reference Guide to assist with the creation of Risks, Issues and Changes in Clarity’s Modern User Experience. Document covers both the creation and management of these items.
 -
 A Quick Reference Guide to assist in the creation of risks, issues and change requests in Clarity. The document show this with screenshots from the Classic UX with the Phoenix theme.
 -
 This training document is a Rego Consulting Quick Reference Guide to assist with creating and management of a project team in Clarity’s Modern User Experience. The document reviews accessing teams, creating a team, allocating a team on an investment, as well as additional team related information.
 -
 PMOs/EPMOs are feeling some pressure from Agile disruptors in their organizations. Some Agile purists insist that they can do everything with an Agile tool and no PMO governance, but this really isn’t the case. If you belong to a PMO or EPMO, this session will help you to better collaborate with your Agile counterparts in finding better and more holistic solutions to value delivery. Tips on how to use Agile principles in your talking points will also be shared.
 -
 A presentation slide deck from Rego University 2022. The document reviews creating views and using Apps in Rally. Then digs into creation of Dashboards.
- Refresh on Creating View and Using Apps
- Introduction to Concepts of Dashboards
- Configuring Dashboards & Apps
- Patterns of Useful Dashboards
- Dashboard Patterns
- Examples
- Exercise: Lets create a Dashboard
-
 This training document is a Rego Consulting Quick Reference Guide to assist with creating Custom Investments in Clarity’s Modern User Experience. The document reviews creating a Custom Investment Type and creating a Custom Investment Record.
 -
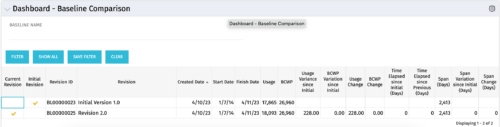 The Dashboard: Baseline Comparison portlet compares multiple baselines on a single project. The portlet is added to the dashboard page of a project and will pull in both baselines for that project and perform a comparison between the two. This portlet provides a quick way for project managers to view the differences between their baselines, especially if they have multiple members updating the project.
 -
The Dashboard: Baseline Comparison portlet compares multiple baselines on a single project. The portlet is added to the dashboard page of a project and will pull in both baselines for that project and perform a comparison between the two. This portlet provides a quick way for project managers to view the differences between their baselines, especially if they have multiple members updating the project.
-
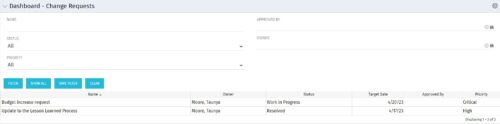 The Dashboard: Change Requests portlet gives an overview of all change requests on the project. The portlet will pull the "id" from the page it is placed on, so this portlet is usually placed on the project dashboard tab. The portlet sorts the issues first by priority and then by target date. It displays the name, owner, status, target date, approved by, and the priority.
 -
The Dashboard: Change Requests portlet gives an overview of all change requests on the project. The portlet will pull the "id" from the page it is placed on, so this portlet is usually placed on the project dashboard tab. The portlet sorts the issues first by priority and then by target date. It displays the name, owner, status, target date, approved by, and the priority.
-
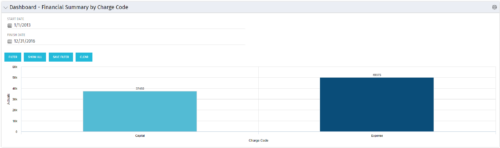 The Dashboard: Financial Summary by Charge Code portlet displays financial information from the project summarized by Charge Code. The portlet is added to the dashboard page of a project and will pull all actuals by charge code on the project. The user may filter by date range to narrow the results.
 -
The Dashboard: Financial Summary by Charge Code portlet displays financial information from the project summarized by Charge Code. The portlet is added to the dashboard page of a project and will pull all actuals by charge code on the project. The user may filter by date range to narrow the results.
-
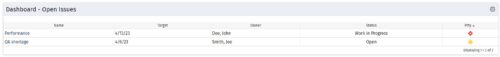 The Dashboard: Open Issues portlet gives an overview of all issues that are not closed or resolved for a single project. The portlet will pull the "id" from the page it is placed on, so this portlet is usually placed on the project dashboard tab. The portlet sorts the issues first by priority and then by target date. It displays the name, target date, owner, status and priority.
 -
The Dashboard: Open Issues portlet gives an overview of all issues that are not closed or resolved for a single project. The portlet will pull the "id" from the page it is placed on, so this portlet is usually placed on the project dashboard tab. The portlet sorts the issues first by priority and then by target date. It displays the name, target date, owner, status and priority.
-
 The Dashboard: Open Milestones portlet gives an overview of all milestones that are started or not started for a single project. The portlet will pull the "id" from the page it is placed on, so this portlet is usually placed on the project dashboard tab. The milestones are sorted by Due Date. It displays the name, Due Date, Baseline Date, Days Late (Due Date – Baseline Date), and Days Old (Current Date – Due Date).
 -
The Dashboard: Open Milestones portlet gives an overview of all milestones that are started or not started for a single project. The portlet will pull the "id" from the page it is placed on, so this portlet is usually placed on the project dashboard tab. The milestones are sorted by Due Date. It displays the name, Due Date, Baseline Date, Days Late (Due Date – Baseline Date), and Days Old (Current Date – Due Date).
-
 The Dashboard: Open Risks portlet gives an overview of all risks that are not closed or resolved for a single project. The portlet will pull the "id" from the page it is placed on, so this portlet is usually placed on the project dashboard tab. The portlet sorts the risks first by priority and then by target date. It displays the name, owner, target date, probability impact, and priority.
 -
The Dashboard: Open Risks portlet gives an overview of all risks that are not closed or resolved for a single project. The portlet will pull the "id" from the page it is placed on, so this portlet is usually placed on the project dashboard tab. The portlet sorts the risks first by priority and then by target date. It displays the name, owner, target date, probability impact, and priority.
-
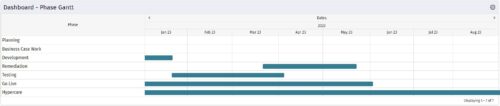 The Dashboard: Phase Gantt portlet gives an overview of all WBS level 1 tasks or milestones for a single project. The portlet will pull the "id" from the page it is placed on, so this portlet is usually placed on the project dashboard tab. The portlet displays the name, and a graphical representation of the timeline for the phases. The date range may be configured by day, month, year, or quarter. The start date may also be configured to any date or a relative date (start of current month, start of next year, etc).
 -
The Dashboard: Phase Gantt portlet gives an overview of all WBS level 1 tasks or milestones for a single project. The portlet will pull the "id" from the page it is placed on, so this portlet is usually placed on the project dashboard tab. The portlet displays the name, and a graphical representation of the timeline for the phases. The date range may be configured by day, month, year, or quarter. The start date may also be configured to any date or a relative date (start of current month, start of next year, etc).
-
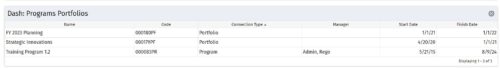 The Dashboard: Programs Portfolios portlet is placed on the dashboard page of a project. This portlet will show any programs or portfolios the project is a subproject of. The portlet will display the name, code, connection type, manager, and start/finish dates.
 -
The Dashboard: Programs Portfolios portlet is placed on the dashboard page of a project. This portlet will show any programs or portfolios the project is a subproject of. The portlet will display the name, code, connection type, manager, and start/finish dates.


Copyright 2023 • Rego Consulting Corporation • Privacy Policy