-
 Join Rego’s senior Agile guides and learn best-practice usage patterns to support your ART-level practices with Rally Software. We’ll explore all the ceremonies in a team-of-team (ART) program increment and how you can use Rally to align, simplify, and leverage for scaled delivery of high-value solutions.
 -
 The hit TV series Ted Lasso is well known for its humor and entertainment value, but hidden under the light-hearted banter are some important messages that leaders can take to heart. Join expert Agile guide, Tad Beaty, for a review of the first two seasons of the show. We’ll explore the messages that all leaders should take back to the office to improve engagement and make a better workplace.
 -
 Hear what the journey from Project to Product looks like from the trenches. IHG will share tales of what it took to make this transition, some challenges they faced, and what outcomes they have been able to achieve.
 -
 The leadership of your organization plays a vital role in the success of your Agile transformation. It is not always known or understood what role and what specific activities and behaviors are needed by leadership. In this session you will gain some guidance on how to appropriately get your senior leaders on board and ensure they are positioned to support the Agile journey in the most effective manner
 -
 Agile metrics can be very different from traditional waterfall metrics. This session will walk through some of the key Agile metrics describing how and why they are used. Effective methods in reporting and sharing will also be covered.
 -
 Agile is here to stay, but waterfall may be as well. Companies around the world struggle with living in a bimodal development world, while trying to go through an agile transformation. This session will discuss best practices and lessons learned within companies that have gone through agile transformations. We will also review SAFe as a potential approach.
 -
 Learn about the various techniques and emerging methods companies are taking to capitalize Agile work. You'll learn how some companies are moving away from timesheets and using models based on story points and team rates to generate capitalization reporting.
 -
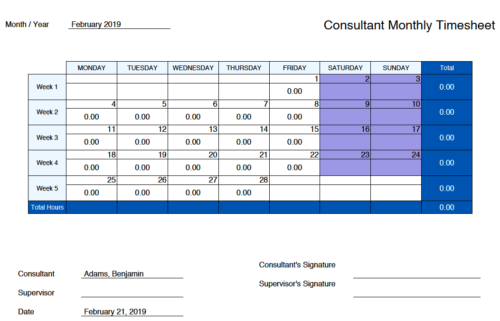
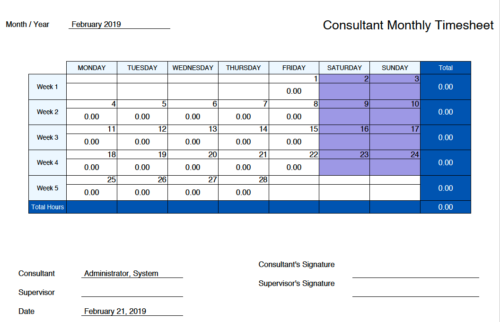 Monthly Actuals -User View is a standard calendar view of actuals posted by logged in user on each day of the selected month. Actuals also includes timesheets that haven’t been submitted/posted yet. Actual hours on the report are tied to user's availability i.e. when user has 0 availability (Saturday/Sunday/Holiday) then actuals are greyed out.
 -
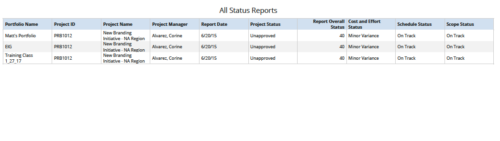 All Status Reports is a grid report that provides project managers a single place to current status report for a single project or across multiple projects. This report provides project information such as ID, Name, Manager, Status, Status report KPI’s (Report overall status, Cost and Effort status, Schedule status & Scope Status) and Portfolio Name. You can further narrow your search by OBS Type, OBS Path, Project Name, Project Manager, Status, Overall Status and Portfolio Name.
 -
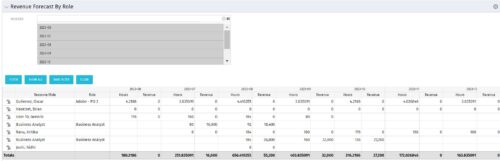 The Revenue Forecast by Role portlet displays forecasted revenue by both resource and role on the given project, broken out by month. The table below describes the available filter fields in the portlet.
Column Label Description Months Fiscal months to display -
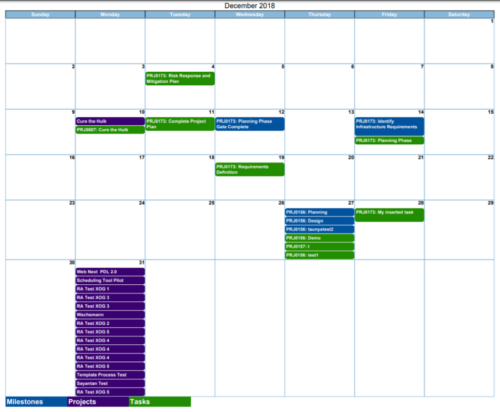
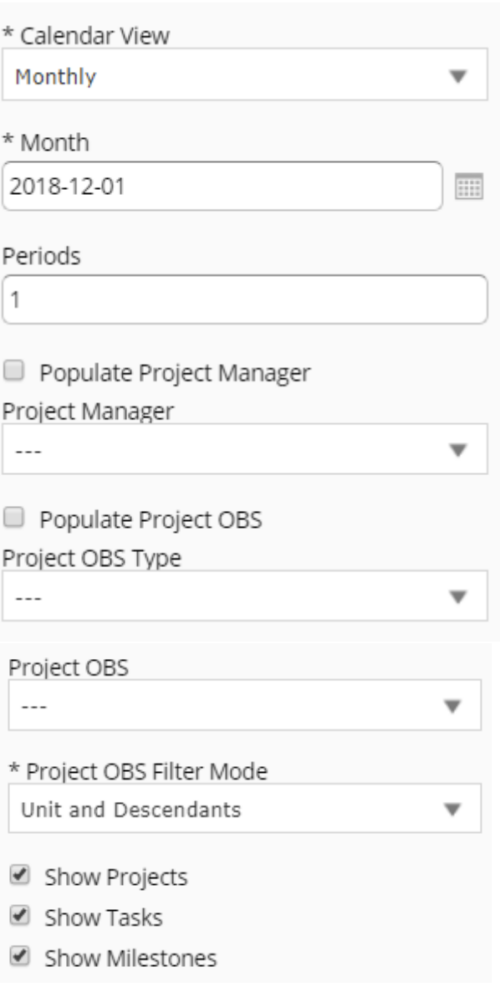 Calendar View report provides a view of Projects, Milestones or Tasks that has finish date within the user selected month. User has the flexibility to choose to Calendar view as Monthly or Weekly and also number of periods that needs to be displayed in the report. Report can be filtered to show only Projects or Milestones or Tasks with the checkboxes provided. It can also be further filtered using Project Manager and Project OBS parameters.
 -
 Monthly Actuals - Admin is a standard calendar view of actuals posted by a user on each day of the selected month. Actuals also includes timesheets that haven’t been submitted/posted yet. Actual hours on the report are tied to user's availability i.e. when user has 0 availability (Saturday/Sunday/Holiday) then actuals are also greyed out.
 -
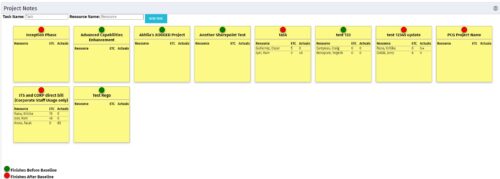 The Task-At-A-Glance Notes portlet provides a view of project tasks and assignments in an easy to read format, similar to popular sticky – note applications. This portlet will display all tasks on a project, ‘pinning’ them to a dashboard. Each task will include the resources assigned to them, as well as the ETCs left for the resource, and the actuals that they have posted. Each sticky note allows you to link to the task details, as well as the resource assignment details. In addition to important assignment detail, each pin on the individual task’s note indicates if the task finishes before the baseline (green), or if it is going to finish after the baseline (red).
 -
The Task-At-A-Glance Notes portlet provides a view of project tasks and assignments in an easy to read format, similar to popular sticky – note applications. This portlet will display all tasks on a project, ‘pinning’ them to a dashboard. Each task will include the resources assigned to them, as well as the ETCs left for the resource, and the actuals that they have posted. Each sticky note allows you to link to the task details, as well as the resource assignment details. In addition to important assignment detail, each pin on the individual task’s note indicates if the task finishes before the baseline (green), or if it is going to finish after the baseline (red).
-
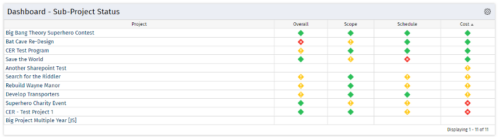 The Program Dashboard Sub-Project Status portlet gives the ability to view the most recent status report for all sub-projects on a program. The portlet will pull the "id" from the page it is placed on, so this portlet is usually placed on the dashboard tab. This portlet displays each sub-project, type of status, and the symbol related to the severity.
 -
The Program Dashboard Sub-Project Status portlet gives the ability to view the most recent status report for all sub-projects on a program. The portlet will pull the "id" from the page it is placed on, so this portlet is usually placed on the dashboard tab. This portlet displays each sub-project, type of status, and the symbol related to the severity.
-
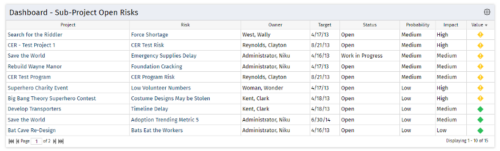 The Program Dashboard Sub-Project Open Risks portlet gives the ability to view all risks on the sub-projects of a program that are not closed or resolved. The portlet will pull the "id" from the page it is placed on, so this portlet is usually placed on the dashboard tab. The portlet sorts the issues first by value, in descending order, and then by target date. It displays the sub-project name, risk name, owner, target date, status, probability, impact and value.
 -
The Program Dashboard Sub-Project Open Risks portlet gives the ability to view all risks on the sub-projects of a program that are not closed or resolved. The portlet will pull the "id" from the page it is placed on, so this portlet is usually placed on the dashboard tab. The portlet sorts the issues first by value, in descending order, and then by target date. It displays the sub-project name, risk name, owner, target date, status, probability, impact and value.
-
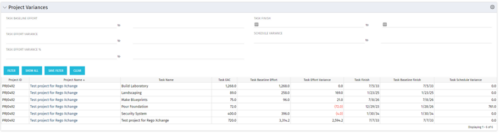 This Project Variances portlet provides a project manager a consolidated view of all of their active projects and open project tasks and shows them the baseline variance for the task EAC’s and the task start and finish dates. This gives the project manager a single place to view and manage how their projects are progressing against their baselines. The PM can easily detect when projects are running behind and pinpoint which tasks are causing the variance in the schedule.
 -
This Project Variances portlet provides a project manager a consolidated view of all of their active projects and open project tasks and shows them the baseline variance for the task EAC’s and the task start and finish dates. This gives the project manager a single place to view and manage how their projects are progressing against their baselines. The PM can easily detect when projects are running behind and pinpoint which tasks are causing the variance in the schedule.
-
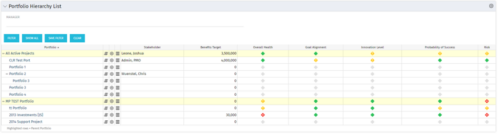 Part of the Business Transformation Package, this portlet displays the portfolios with hierarchy (child portfolio(s)). The portlet displays the basic portfolio fields like – manager, stakeholder, etc. A Metrics subpage can be created with the fields on the “Properties – Metrics.”. The fields: Overall Health, Goal Alignment, Innovation Level, Probability of Success are custom fields and can be configured on a subpage.
 -
 This portlet shows the project costs by Month. The information displayed includes:
- Start Date for project
- End Date for project
- Budgeted Cost
- Planned Cost
- Actual Hours
-
This portlet shows the project costs by Month. The information displayed includes:
- Start Date for project
- End Date for project
- Budgeted Cost
- Planned Cost
- Actual Hours
-
This portlet shows the project costs by Month. The information displayed includes:
- Start Date for project
- End Date for project
- Budgeted Cost
- Planned Cost
- Actual Hours
-
 This configuration and accompanying process allows users to capture Financial and Non-Financial (Metrics, Soft, etc.) Benefit in a custom sub-object, then programmatically create an out-of-the-box Benefit Plan with just the Financial Portion from the custom sub-object. The solution is comprised of:
- Sub-Object (Benefit Plan Details, Parent = Project)
- Process: Create Benefit Plan (uses sub-object as primary input, native BP is output)
- Process: Update sql - Cost Benefit Plans (one-time script to update Projects)
- Ensure on the Benefit Details List view the Planned and Realized Amounts are displayed
- Modifying the Create Benefit Plan Process in support of a BP naming convention consistent with local PMO Practices
- Modifying the Create Benefit Plan Process to link the BP to the Cost Plan of Record
- Creating a Portlet that pulls together rows of data from the sub-object across multiple projects in a summarized view as well as a detailed view
-
This configuration and accompanying process allows users to capture Financial and Non-Financial (Metrics, Soft, etc.) Benefit in a custom sub-object, then programmatically create an out-of-the-box Benefit Plan with just the Financial Portion from the custom sub-object. The solution is comprised of:
- Sub-Object (Benefit Plan Details, Parent = Project)
- Process: Create Benefit Plan (uses sub-object as primary input, native BP is output)
- Process: Update sql - Cost Benefit Plans (one-time script to update Projects)
- Ensure on the Benefit Details List view the Planned and Realized Amounts are displayed
- Modifying the Create Benefit Plan Process in support of a BP naming convention consistent with local PMO Practices
- Modifying the Create Benefit Plan Process to link the BP to the Cost Plan of Record
- Creating a Portlet that pulls together rows of data from the sub-object across multiple projects in a summarized view as well as a detailed view
-
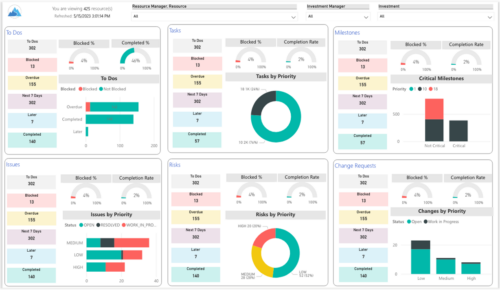 Make sure project deliverables are completed on time by tracking work progress and monitoring task assignments. Report Views include:
- Work Details
- Work Overview
- Work Risk Issue and Change
-
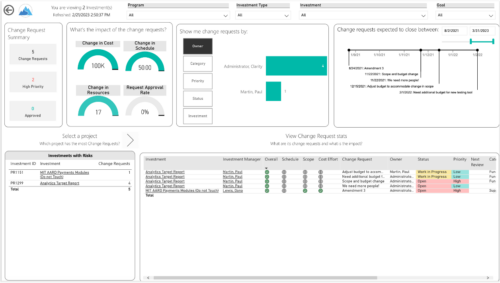
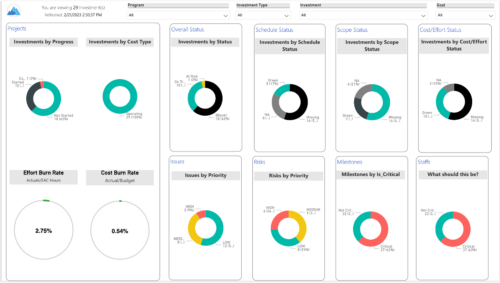 Gain an overview of program-level performance, track program milestones, and assess overall program health. Report Views include:
- Change Requests
- Program Costs Trend
- Program Costs
- Program Drill Thru
- Program Effort
- Program Gantt
- Program Issues
- Program Milestones
- Program Risks
- Program Staff
- Program Status Reports
- Program Summary
- Program Tasks
-
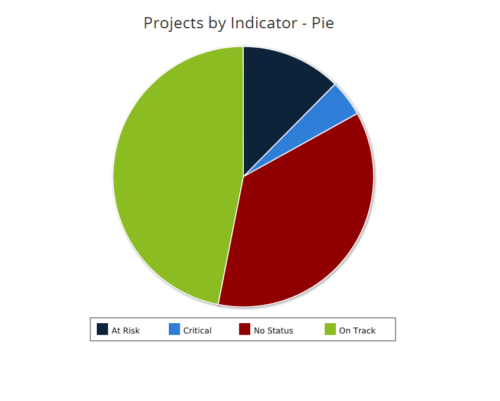 Projects by Status Indicator is a pie chart that displays count of projects by out of box Status Indicator attribute. Legend displays the colors associated with various Status Indicator values. Mouse over the pie chart slice displays the count of projects associated with that respective Status Indicator value. You can further narrow your search by OBS Path, Project Manager and Is Project Active?.
 -
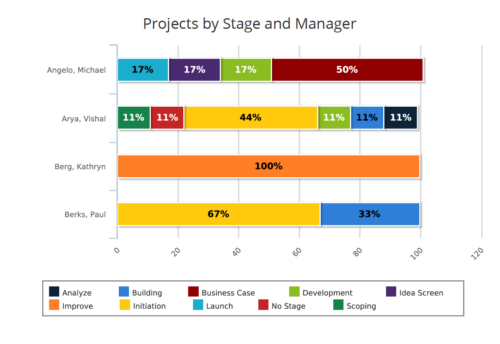 Projects by Stage and Manager report is a stacked bar chart that displays percentage of projects associated with project manager at a particular stage. Legend displays colors used to represent various Project Stages. This report provides to PMO a quick snapshot of where certain projects are sitting with each Project Manager. You can further narrow your search by Project Manager, Project Name, Is Project Active? , Is Template? And Is Program?
 -
 This portlet displays Actual Time by Project over a span of time. It supports Annual, Quarterly, Monthly, and Weekly time periods. The time span displayed is controlled by a filter field for the Start Date (of the time span) and by a filter field for the Number of Time Periods to be displayed. There are also filters for Project name, Project Manager, and Project Type.
 -
This portlet displays Actual Time by Project over a span of time. It supports Annual, Quarterly, Monthly, and Weekly time periods. The time span displayed is controlled by a filter field for the Start Date (of the time span) and by a filter field for the Number of Time Periods to be displayed. There are also filters for Project name, Project Manager, and Project Type.


Copyright 2023 • Rego Consulting Corporation • Privacy Policy