-
 A review of how Northern Trust integrates financial systems with Clarity PPM bilaterally, providing the Finance organization crucial information, and NT Project Managers with a birds-eye view of project financials. Utilizing the Rego Data Extractor and the Rego Data Processor, these information exchanges help Portfolio and Project Managers eliminate their manual and redundant efforts, solidify their overall data accuracy, and dramatically improve the content provided to their Execs for decision-making.
 -
 Are you struggling with implementing Agile tools in your organization in addition to Clarity? This class will review best practices for implementing agile tools in conjunction with Clarity - living in a Bi-Modal world. We will discuss how Clarity can be used to govern both types of work and teams and how Agile tools should interface into Clarity.
 -
 Have you considered using Rally in conjunction with Clarity? Have you seen or heard about the OOTB connector? This class will go through the OOTB connector in detail and show how Rego has built our ad-on to enhance the connectivity between these two tools.
 -
 Rally Software introduction including high level feature and functionality for Agile and portfolio planning and tracking, analytics and reporting, and overall benefits of Rally in the marketplace along with a product demo.
 -
 Course Description: Have you considered using Rally Software® in conjunction with Clarity PPM? Have you seen or heard about the OOTB connector? This class will go through the OOTB connector in detail and show how Rego has built addons to enhance the connectivity between these two tools.
 -
 Course Description: Some PMO members have started receiving questions about the relevance of the PMO. This session will discuss why the PMO is even more relevant for an organization as it shifts to an Agile mindset.
 -
 Course Description: Do some folks in your organization view Clarity PPM as worthless or of little value? In this class, we will discuss how to increase the value perception of Clarity PPM and innovative ways to sell the value Clarity PPM provides to stakeholders and users.
 -
 Most organizations use CA PPM as part of an annual planning process, in conjunction with an ITFM or financial system. There is often a struggle to know where CA PPM fits into the process and how to effectively connect the data and processes between these tools. In this class, we will discuss how a PPM tool and an ITFM tool fit together to support annual planning.
 -
 Are you on an older version of CA PPM? Do you want to understand the value of the new features and functions in recent versions? Have you seen the new UX and do you wonder when is the right time to move over? This class is a demonstration of the new UX, new features in both classic and new UX, and the value of these features for customers.
 -
 The Give RM Calendar & Time Rights workflow process can be run through the "Execute a Process" job. The workflow will execute a query that gives a Resource Manager Calendar Edit and Timesheet Edit rights for their resources. These rights are not inherent for Resource Managers when they are named as an individual’s resource manager.
 -
 The PM Stalker – Submit Status Report workflow process will email any project manager that has not submitted a status report in the last two weeks. This process will ensure that all status reports are kept up-to-date and provide management with a reliable overview of the status on the project.
 -
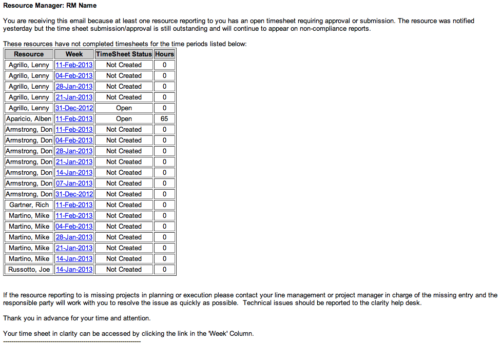 The Time Tracking Stalker - RM workflow process automatically sends an email to Resource Managers for each one of their resources that have not submitted their timesheet for a prior open time period, thus informing the RM if their resources are submitting their timesheets on time. Project Managers will also benefit since the notifications will help to ensure that time is being posted against their projects in a timely manner, helping to provide them with an accurate view of time expended on the projects.


Copyright 2023 • Rego Consulting Corporation • Privacy Policy