-
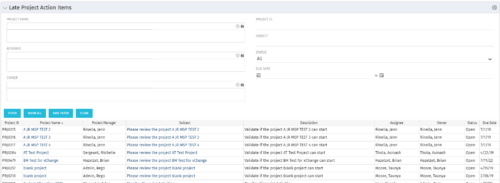 The Late Project Action Items portlet displays all action items related to active projects that the logged in user has view rights to. The action items displayed are those that are past their due date with a status of “In Progress” or “Open”. The portlet provides a Project Manager the ability to view and track action items across multiple projects without going into each project individually. In a single consolidated list, all late project action items can be easily viewed, along with the project with which they are associated, the individual assigned, and the owner of the action item.
 -
The Late Project Action Items portlet displays all action items related to active projects that the logged in user has view rights to. The action items displayed are those that are past their due date with a status of “In Progress” or “Open”. The portlet provides a Project Manager the ability to view and track action items across multiple projects without going into each project individually. In a single consolidated list, all late project action items can be easily viewed, along with the project with which they are associated, the individual assigned, and the owner of the action item.
-
 Late Milestones report displays the list of all milestones that are not closed but are past their finish date or past their baseline finish date. The report provides Project Manager the ability to view and track late milestones across multiple projects without going into each project individually. This report displays Project ID, Project Name, Project Manager, Milestone Name, Due Date, Baseline Date, Days Late (Elapsed days between Task Finish date and Task Baseline Finish date), and Days Old (Elapsed days between Task Finish Date and Today's Date). User can further narrow their search by Project ID, Project Name, Project Manager Name, Milestone Name, Due Date between, Baseline Date between, Is Milestone?, Is late?, Task Status, Is Template?. User can use exact dates or relative dates for Due Date between and Baseline Date between filter parameters.
 -
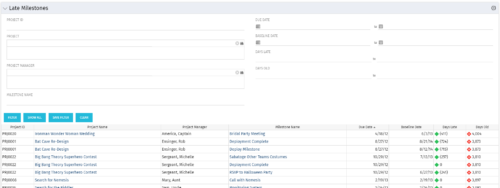 The Late Milestones portlet displays all action items related to active projects that the logged in user has view rights to. The milestones displayed are those that are not closed but are past their finish date or past their baseline finish date. The portlet provides a Project Manager the ability to view and track action items across multiple projects without going into each project individually. This portlet provides a single consolidated view of late milestones based on the current project baseline, and the age of the milestone. The portlet will display the Project ID, Project Name, Project Manager, Milestone Name, Due Date, Baseline Date, Days Late (calculated from baseline dates), and Days Old (calculated from today’s date).
 -
The Late Milestones portlet displays all action items related to active projects that the logged in user has view rights to. The milestones displayed are those that are not closed but are past their finish date or past their baseline finish date. The portlet provides a Project Manager the ability to view and track action items across multiple projects without going into each project individually. This portlet provides a single consolidated view of late milestones based on the current project baseline, and the age of the milestone. The portlet will display the Project ID, Project Name, Project Manager, Milestone Name, Due Date, Baseline Date, Days Late (calculated from baseline dates), and Days Old (calculated from today’s date).
-
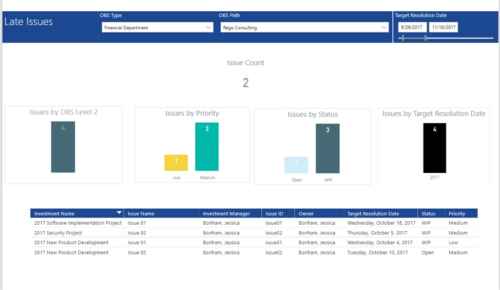 Late Issues report provides the Project Managers a single place to view all the Open Issues that are past their target resolution date. This report provides information such as Issue Count, Issues by OBS Level 2, Priority, Status and Target Resolution Date in Stacked Column Chart. In addition, this report has also Table view of Issue information such as Investment Name, Issue Name, Investment Manager, Issue ID, Owner, Target Resolution Date, Status and Priority. User can further narrow their search by OBS Type & Path and Target Resolution Date.
 -
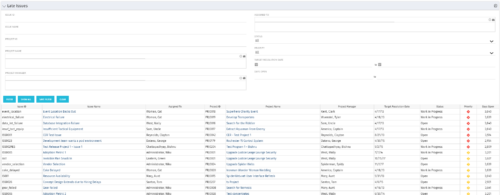 The Late Issues portlet displays all issues related to active projects that the logged in user has view rights to. The issues displayed are those that are past their target resolution date but not Closed or Resolved. The portlet provides a Project Manager the ability to view and track issues across multiple projects without going into each project individually. This portlet displays the issue, the associated project name and project manager, as well as the issue owner, target resolution date, status, and priority of the issue, along with the total number of days the issue has been open. The user has the ability to filter by several criteria in order to narrow down the late issues.
 -
The Late Issues portlet displays all issues related to active projects that the logged in user has view rights to. The issues displayed are those that are past their target resolution date but not Closed or Resolved. The portlet provides a Project Manager the ability to view and track issues across multiple projects without going into each project individually. This portlet displays the issue, the associated project name and project manager, as well as the issue owner, target resolution date, status, and priority of the issue, along with the total number of days the issue has been open. The user has the ability to filter by several criteria in order to narrow down the late issues.
-
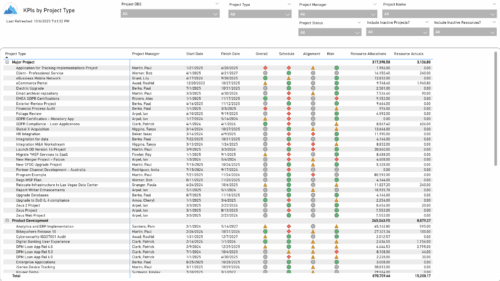 The KPIs by Project Type report provides a consolidated view of key performance indicators across projects, grouped by project type. It highlights metrics such as overall status, schedule, alignment, and risk, along with resource allocation and actual hours tracked since each project’s inception. This report enables quick comparison of performance trends and resource utilization across different project types.
 -
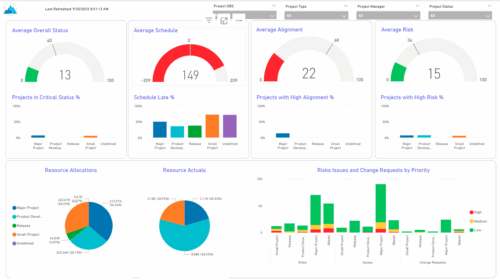 The KPIs by Project Type (Dashboard) report provides visibility into key project health measures, including status, schedule, alignment, and risk. Gauge visuals highlight each KPI at a summary level, while column charts break down results by project type. Resource allocation and actual hours are summarized in pie charts, making it easy to compare utilization across project types. In addition, bar charts display the number of issues, risks, and change requests by project type and priority, helping teams quickly identify areas of concern.
 -
 The Key Tasks & Milestone Status report delivers comprehensive visibility into task and milestone performance through intuitive Start Date and Finish Date visualizations. It consolidates critical execution details, including task status, WBS type, and associated attributes such as project name, project manager, overall project status, and task completion percentage. The report supports dynamic filtering across multiple dimensions, including projects, OBS path, OBS type, task status, and WBS type, enabling targeted analysis and rapid insight. Interactive dashboards facilitate effective tracking, monitoring, and governance of tasks and milestones across the projects.
 -
 Most organizations use CA PPM as part of an annual planning process, in conjunction with an ITFM or financial system. There is often a struggle to know where CA PPM fits into the process and how to effectively connect the data and processes between these tools. In this class, we will discuss how a PPM tool and an ITFM tool fit together to support annual planning.
 -
 This portlet will allow administrators or other managers to see what resources have been granted instance rights to any investment. Filtering is available by resource, investment or right.
 -
This portlet will allow administrators or other managers to see what resources have been granted instance rights to any investment. Filtering is available by resource, investment or right.
-
This portlet will allow administrators or other managers to see what resources have been granted instance rights to any investment. Filtering is available by resource, investment or right.
-
 The Investment Resource Rate portlet allows a user to search for effective (or missing) rates for resources across all investment types. It pulls rate information from the matrix extraction tables and includes currency conversion if the environment supports multiple currencies. The portlet can be used both to search for the rate of any given resource and to determine which resources might be missing rates when an error is generated when attempting to populate a cost plan (REVMGR-20728:Rates and Costs are both missing for one or more roles/resources).
 -
The Investment Resource Rate portlet allows a user to search for effective (or missing) rates for resources across all investment types. It pulls rate information from the matrix extraction tables and includes currency conversion if the environment supports multiple currencies. The portlet can be used both to search for the rate of any given resource and to determine which resources might be missing rates when an error is generated when attempting to populate a cost plan (REVMGR-20728:Rates and Costs are both missing for one or more roles/resources).
-
 The Investment Issue Register report displays comprehensive information for each investment issue. The report only includes investments where the Risk, Issues, and Change modules are available. Report Prerequisites Verify that you have completed the following prerequisites before you run this report: • The investment must have at least one issue for the project to display in the report. • The issue properties must have fields such as description, category, resolution, target resolution, impact date, and originating ID completed for them to display data in the report. The issue name, issue ID, priority, status, and owner are required in Classic PPM so they always display data. • The Load Data Warehouse job must be run before you run this report. If the Data Warehouse is not populated, the report will not display any data. Also, most of the report parameters do not display options.
 -
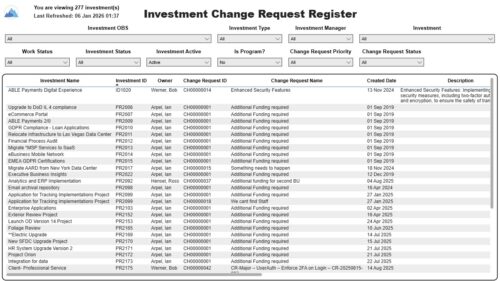 The Investment Change Request Register report displays comprehensive information for each investment change request. The report only includes investments where the Risk, Issues and Change modules are available. Report Prerequisites Verify that you have completed the following prerequisites before you run this report: • The investment must have at least one change request for the project to display in the report. • The change request properties must have fields such as description, change in cost, change in schedule, change in resources, category, expected close, approved by, approved date, and originating ID completed for them to display data in the report. The change request name, change request ID, priority, status, and owner are required in Classic PPM so they always display data. • The Load Data Warehouse job must be run before you run this report. If the Data Warehouse is not populated, the report will not display any data. Also, most of the report parameters do not display options.
 -
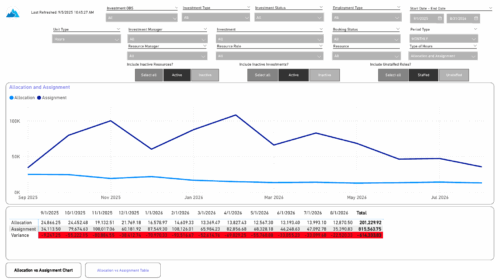 The Investment Allocations and Assignments report provides visibility into team member allocation, task assignment, and variance amounts by investment across time periods. A chart highlights allocation compared to assignment amounts by period. Results can be displayed by week, month, or in total, and viewed in either hours or FTEs for each team member and investment. Interactive visuals make it easy to compare planned effort against actual assignments at the team member and investment level. Content Type: Business Intelligence, PowerBI Report
 -
 Want to boost Clarity adoption and data quality, all while having fun and keeping users engaged? Learn how gamification can benefit your organization in this exclusive demo. Check out features that reward users for desired behaviors, enable personalization, and offer fun ways to track project health through the animated world of Planimals.


Copyright 2023 • Rego Consulting Corporation • Privacy Policy