-
 This training document is a Rego Consulting Quick Reference Guide to assist with the utilization of Tasks and To Do’s in Clarity’s Modern User Experience. This doc references version 16.0.2 views.
 -
 This training document is a Rego Consulting Quick Reference Guide to assist with the utilization of Tasks and To Do’s in Clarity’s Modern User Experience. This doc references version 16.0.3 views. Document references the Tasks and To Do’s menu items and their associated widgets.
 -
 This training document is a Rego Consulting Quick Reference Guide to assist with the utilization of Tasks and To Do’s in Clarity’s Modern User Experience. This doc references version 16.1.2 views. Document references the Tasks and To Do’s menu items and their associated widgets.
 -
 This training document is a Rego Consulting Quick Reference Guide to assist with the utilization of Tasks and To Do’s in Clarity’s Modern User Experience. This doc references version 16.1 views. Document references the Tasks and To Do’s menu items and their associated widgets.
 -
 This training document is a Rego Consulting Quick Reference Guide to assist with the utilization of Tasks and To Do’s in Clarity’s Modern User Experience. This doc references version 16.2.1 views. Document references the Tasks and To Do’s menu items and their associated widgets.
 -
 This training document is a Rego Consulting Quick Reference Guide to assist with the utilization of Tasks and To Do’s in Clarity’s Modern User Experience. This doc references version 16.3 views. Document references the Tasks and To Do’s menu items and their associated widgets.
 -
 Course Description: Do you want to analyze the cost and utilization of Agile development resources? Do you struggle to integrate financial information with work execution information from Agile tools such as Rally Software®, Jira, or VersionOne? This session explores reporting and dashboarding approaches to provide technology leaders with KPIs and trends for Agile execution, along with views that relate Agile team activity with cost and delivery.
 -
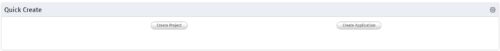 An HTML portlet that displays two buttons that link the user instantly to an object create page. The portlet comes with two buttons and the buttons can be modified to link to any creation page. Administrator can choose: Project, Idea, Application, Program, etc.
 -
An HTML portlet that displays two buttons that link the user instantly to an object create page. The portlet comes with two buttons and the buttons can be modified to link to any creation page. Administrator can choose: Project, Idea, Application, Program, etc.
-
 Rally Software introduction including high level feature and functionality for Agile and portfolio planning and tracking, analytics and reporting, and overall benefits of Rally in the marketplace along with a product demo.
 -
 Rally Software introduction including high level feature and functionality for Agile and portfolio planning and tracking, analytics and reporting, and overall benefits of Rally in the marketplace along with a product demo.
 -
 The Re-Baseline via Change Request process is a simple method for a member of the project (who has the ability to create change requests) to request a re-baseline of the project without the project manager having to perform it. First, the user must create the change request. The user must then start the process within the change request by using the Processes tab. Once started, the process will route an action item to the Project Manager. If rejected, the process will end and the user must start it again (if needed). If approved, the process will then baseline the project and close out the change request.
 -
The Re-Baseline via Change Request process is a simple method for a member of the project (who has the ability to create change requests) to request a re-baseline of the project without the project manager having to perform it. First, the user must create the change request. The user must then start the process within the change request by using the Processes tab. Once started, the process will route an action item to the Project Manager. If rejected, the process will end and the user must start it again (if needed). If approved, the process will then baseline the project and close out the change request.
-
 Part of the Business Transformation collection, this pie chart portlet displays realized benefit, grouped by location of project. This provides the PM with a holistic view of benefits realized across the geographical locations.
 -
Part of the Business Transformation collection, this pie chart portlet displays realized benefit, grouped by location of project. This provides the PM with a holistic view of benefits realized across the geographical locations.
-
Part of the Business Transformation collection, this pie chart portlet displays realized benefit, grouped by location of project. This provides the PM with a holistic view of benefits realized across the geographical locations.
-
 Part of the Business Transformation collection, this line chart portlet displays realized vs planned benefits overtime, for portfolio investments. This provides the PfM with a holistic view of benefits planned vs realized over a period of time.
 -
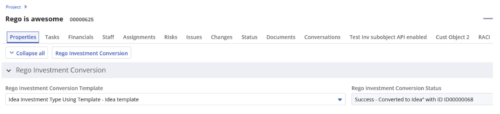
 Converts one Investment type to another investment type. Functionality • One investment type instance converted to another investment type • Investment object level attributes are copied over by default • Investment sub-objects can be chosen to be copied • The attributes and sub-objects to be copied to must be api enabled • Can convert from non api enabled object like other work to api enabled Custom CIT • Attribute mapping does not support multivalued lookups yet • If auto-numbering is not enabled for target investment type of the sub-objects, an ID will be auto-generated. • Associated risks and issues will not be copied over • Target investment status will be "Unapproved" • If there are Mandatory target investment type attributes either o use a template to convert where having a value in the attribute is not mandatory or Have a default value in the mandatory field defined on the object • If effort task creation is enabled, the effort task will also be brought over. o The effort task will appear with custom code if a investment template is used for conversion • The allocations will extend to the finish of the new investment if investment template is used which has tasks • Almost 500 instances of sub-objects are supported at this point. • The values in lookups need to be active or the process will error out • All required attributes must be api enabled
 -
 The Rego PowerBI Reporting Suite features close to 100 free PowerBI reports, designed to enhance project management and reporting capabilities.
 -
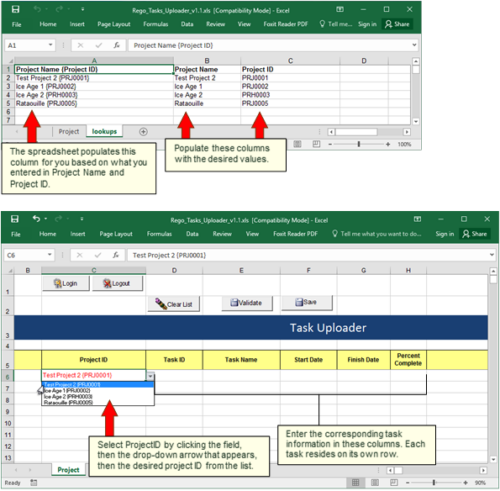 Take your project task information straight from Excel right into CA PPM. Task Name, Start Date, Finish Date and Percent Complete can all be imported or updated directly. Other fields can be added with a short Rego Consulting engagement. Installation of the base app requires 10 hours of Rego Consulting engagement time. Since this item requires Rego staff and hours (see special instructions) to install, download items are informational only. Install files will be utilized by Rego staff.
 -
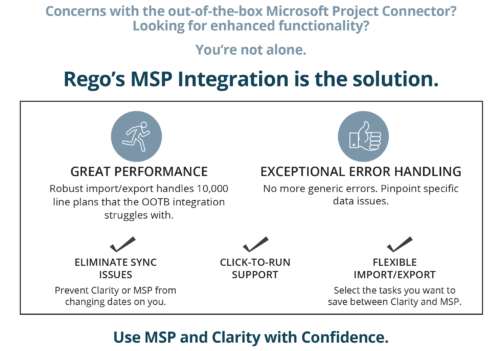
 Have you looked in the regoXchange or reviewed Rego’s innovation offerings? This class will show you the power of Rego’s pre-built content library, integrations, and other assets. See example after example of portlets, processes, and materials you can use to add value to your instance of Clarity. Learn how you can introduce email-based approvals with Rego's action item responder. Get a peek at Rego's new MSP integration that avoids the issues faced with the OOTB integration. Finally, understand Rego's pre-built connectors and how they can benefit your instance. Including blueprint migrator. Include free tools like GEL builder, query, XOGbridge.
 -
 With only 15% of companies successfully transforming digitally, it’s time for the PMO to take charge. This session talks about how the PMO effectively can support the digital transformation within the enterprise by reimagine its traditional charter
 -
 This training document is a Rego Consulting Quick Reference Guide to assist with placeholder role replacement in Clarity’s Modern User Experience. The document reviews accessing and fulfilling requests.
 -
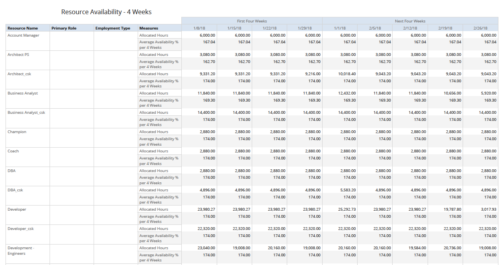 Resource Availability – 4 Weeks displays all resources with their total allocated hours by week, and an average availability percent (4 Wk Avail %) for next four weeks. This report also displays Resource Primary Role and Employment Type. User can further narrow their search by Resource Name, Resource Type & Week Start Date. User can use exact dates or relative dates for Week Start Date filter parameters.
 -
 The Resource Data Issues portlet is used to identify data exceptions related to resource setup. This portlet helps to identify where resources are missing key data or are possibly sitting in an exception state. This view will show resources that have one or many exceptions, including inactive resources. There is no security built into this portlet - all resources will show. The only required field in the filter is Days, which is the number of days since the user last logged in. The user may also narrow the results by resource, OBS, or project type.
 -
The Resource Data Issues portlet is used to identify data exceptions related to resource setup. This portlet helps to identify where resources are missing key data or are possibly sitting in an exception state. This view will show resources that have one or many exceptions, including inactive resources. There is no security built into this portlet - all resources will show. The only required field in the filter is Days, which is the number of days since the user last logged in. The user may also narrow the results by resource, OBS, or project type.
-
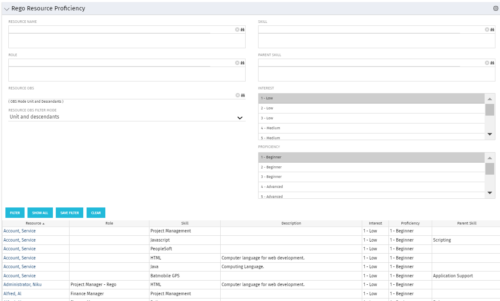 This grid displays Skill Proficiency and Interest Level by Resource. Users can utilize this view to search for Resources by Skill, Parent Skill, Interest, Role, Parent Role, Resource and Resource OBS. This portlet grants a Project Manager or Resource Manager the ability to determine which Resources best fit the needs for their project.
 -
This grid displays Skill Proficiency and Interest Level by Resource. Users can utilize this view to search for Resources by Skill, Parent Skill, Interest, Role, Parent Role, Resource and Resource OBS. This portlet grants a Project Manager or Resource Manager the ability to determine which Resources best fit the needs for their project.
-
 This portlet displays the % allocation of resources to projects. The portlet shows if the resource is allocated to the projects as an individual resource or as part of an Agile team, in which case it will display the resource % allocation to the team and what that will represent in terms of % allocation to the project. The Total Allocation % display the allocation of the resource to all investments is allocated to. Remaining Capacity and Over/Under columns will help identify the resources that still have availability and the ones that are over allocated.
 -
This portlet displays the % allocation of resources to projects. The portlet shows if the resource is allocated to the projects as an individual resource or as part of an Agile team, in which case it will display the resource % allocation to the team and what that will represent in terms of % allocation to the project. The Total Allocation % display the allocation of the resource to all investments is allocated to. Remaining Capacity and Over/Under columns will help identify the resources that still have availability and the ones that are over allocated.
-
This portlet displays the % allocation of resources to projects. The portlet shows if the resource is allocated to the projects as an individual resource or as part of an Agile team, in which case it will display the resource % allocation to the team and what that will represent in terms of % allocation to the project. The Total Allocation % display the allocation of the resource to all investments is allocated to. Remaining Capacity and Over/Under columns will help identify the resources that still have availability and the ones that are over allocated.


Copyright 2023 • Rego Consulting Corporation • Privacy Policy