-
 Course Description: Do some folks in your organization view Clarity PPM as worthless or of little value? In this class, we will discuss how to increase the value perception of Clarity PPM and innovative ways to sell the value Clarity PPM provides to stakeholders and users.
 -
 Funnel Chart displays aggregated counts of Ideas by “Idea Progress”, a custom attribute. Chart shows Idea Progress names in legend, and count total is available as a mouse-over. No filters available on this portlet.
 -
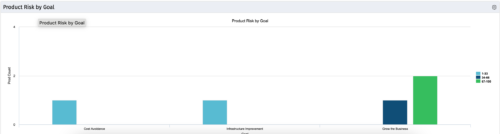 The Product Risk by Goal portlet displays a count of active products by goal with a sub-count by risk. The graph is color-coded by risk rating:
- 1-33 – Green
- 34-66 – Yellow
- 67-100 – Red
-
 The Application Cost by Year portlet displays the active application cost by year, summarized by goal. The application cost is pulled from the application's planned cost and is displayed by year, with colors representing each application goal. This portlet provides management with a quick overview of all application costs without having to navigate to each application individually.
 -
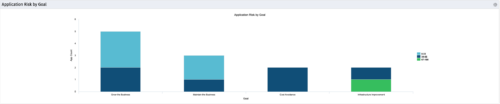 The Application Risk by Goal portlet displays a count of active applications by goal with a sub-count by risk. The graph is color-coded by risk rating:
- 1-33 – Green
- 34-66 – Yellow
- 67-100 – Red
-
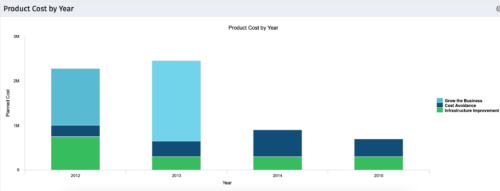 The Product Cost by Year portlet displays active product cost by year, summarized by goal. The product cost is pulled from the product’s planned cost and is displayed by year, with colors representing each product goal. This portlet provides management with a quick overview of all product costs without having to navigate to each product individually.
 -
 This training document is a Rego Consulting Quick Reference Guide to assist with the management of Custom Investment Types in Clarity’s Modern User Experience. This doc references version 16.1 views. Document provides detail on how to create a Custom Investment Type and how to create Custom Investment records from the Grid View and the Board View.
 -
 Part of the Business Transformation Content collection, this bar chart portlet displays count of ideas per business unit. This provides a holistic view of the idea pipe-line in an organization providing them a high-level of ideas converted, approved, unapproved per business unit.
 -
Part of the Business Transformation Content collection, this bar chart portlet displays count of ideas per business unit. This provides a holistic view of the idea pipe-line in an organization providing them a high-level of ideas converted, approved, unapproved per business unit.
-
 This portlet pulls back the Availability and Allocation totals by Role between a user-specified Start and Finish Date, then the user can drilldown to look at the information for Applications. The Time Period filter allows for comparing these values across different timeframes (monthly, weekly, quarterly, annual) as desired. Other filters allow for looking at Active or Inactive Roles (or both) and including Active or Inactive Projects (or both) in the totals.
 -
 Part of the Business Transformation collection, this grid portlet displays idea details for all ideas (active and inactive) and all status conditions. This is an editable portlet based on the Ideas data provider. Filterable by OBS structure, Active/Inactive, and Status.
 -
 An HTML portlet that displays two buttons that link the user instantly to an object create page. The portlet comes with two buttons and the buttons can be modified to link to any creation page. Administrator can choose: Project, Idea, Application, Program, etc.


Copyright 2023 • Rego Consulting Corporation • Privacy Policy