-
 Have you looked in the regoXchange or reviewed Rego’s innovation offerings? This class will show you the power of Rego’s pre-built content library, integrations, and other assets. See example after example of portlets, processes, and materials you can use to add value to your instance of Clarity. Learn how you can introduce email-based approvals with Rego's action item responder. Get a peek at Rego's new MSP integration that avoids the issues faced with the OOTB integration. Finally, understand Rego's pre-built connectors and how they can benefit your instance. Including blueprint migrator. Include free tools like GEL builder, query, XOGbridge.
 -
 Funnel Chart displays aggregated counts of Ideas by “Idea Progress”, a custom attribute. Chart shows Idea Progress names in legend, and count total is available as a mouse-over. No filters available on this portlet.
 -
Funnel Chart displays aggregated counts of Ideas by “Idea Progress”, a custom attribute. Chart shows Idea Progress names in legend, and count total is available as a mouse-over. No filters available on this portlet.
-
Funnel Chart displays aggregated counts of Ideas by “Idea Progress”, a custom attribute. Chart shows Idea Progress names in legend, and count total is available as a mouse-over. No filters available on this portlet.
-
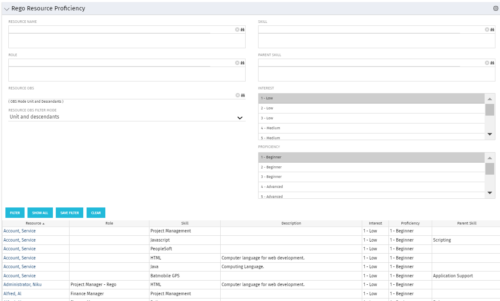 This grid displays Skill Proficiency and Interest Level by Resource. Users can utilize this view to search for Resources by Skill, Parent Skill, Interest, Role, Parent Role, Resource and Resource OBS. This portlet grants a Project Manager or Resource Manager the ability to determine which Resources best fit the needs for their project.
 -
This grid displays Skill Proficiency and Interest Level by Resource. Users can utilize this view to search for Resources by Skill, Parent Skill, Interest, Role, Parent Role, Resource and Resource OBS. This portlet grants a Project Manager or Resource Manager the ability to determine which Resources best fit the needs for their project.
-
 Pie Chart displays total Ideas by Priority, filterable by Active / Inactive and by OBS structure. Data Label and Mouse-over label display counts by Priority. Legend shows Priority Name. Chart also shows Ideas with No Priority.
 -
 Pie Chart displays count of all Ideas by Department. Filterable by Active and Inactive, by OBS, and by Department Manager. Data label and mouse-over show department counts. Legend displays department names.
 -
Pie Chart displays count of all Ideas by Department. Filterable by Active and Inactive, by OBS, and by Department Manager. Data label and mouse-over show department counts. Legend displays department names.
-
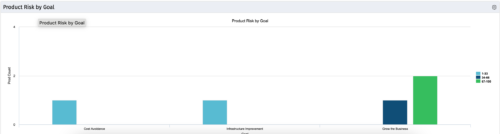 The Product Risk by Goal portlet displays a count of active products by goal with a sub-count by risk. The graph is color-coded by risk rating:
- 1-33 – Green
- 34-66 – Yellow
- 67-100 – Red
-
The Product Risk by Goal portlet displays a count of active products by goal with a sub-count by risk. The graph is color-coded by risk rating:
- 1-33 – Green
- 34-66 – Yellow
- 67-100 – Red


Copyright 2023 • Rego Consulting Corporation • Privacy Policy