-
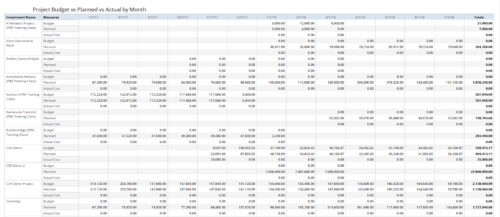 Project Budget vs Planned vs Actual by Month report provides the Project Managers a single place to view Project Budget, Planned and Actual Cost for multiple projects. Project Managers can use this view to compare various costs for that project in a particular month. User can further narrow their search by OBS Type & Path, Is Project Active?, Fiscal Month Start Date, Investment Manager and Investment Name.
 -
 Course Description: Do you want to analyze the cost and utilization of Agile development resources? Do you struggle to integrate financial information with work execution information from Agile tools such as Rally Software®, Jira, or VersionOne? This session explores reporting and dashboarding approaches to provide technology leaders with KPIs and trends for Agile execution, along with views that relate Agile team activity with cost and delivery.
 -
 Learn about the various techniques and emerging methods companies are taking to capitalize Agile work. You'll learn how some companies are moving away from timesheets and using models based on story points and team rates to generate capitalization reporting.
 -
 A review of how Northern Trust integrates financial systems with Clarity PPM bilaterally, providing the Finance organization crucial information, and NT Project Managers with a birds-eye view of project financials. Utilizing the Rego Data Extractor and the Rego Data Processor, these information exchanges help Portfolio and Project Managers eliminate their manual and redundant efforts, solidify their overall data accuracy, and dramatically improve the content provided to their Execs for decision-making.
 -
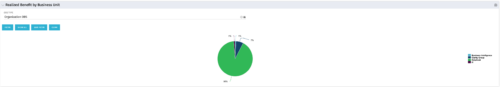 Pie Chart that aggregates Realized Benefit (Total Actual Benefit) by OBS for active projects. Only a Benefit Plan associated with the Cost Plan of Record will return data. The filter allows you to select which OBS filter you prefer to use for this pie chart, however, only an OBS associated with Projects will return data.
 -
 Bar Chart displays average percent variance for all active projects by OBS unit. Percent variance = Planned Cost - Budgeted Cost / Budgeted Cost * 100. Projects with no Budgeted Cost are ignored for the calculation. Then all project variance percentages are algebraically added (some may be negative), and divided by total projects with a variance. This yields the Average Percent Variance. This calculation is performed for active projects in each OBS unit. OBS units include all units at all levels where projects are attached. Portlet filterable by OBS, Financial Status, and Financially Approved. Vertical axis = OBS Unit Name. Horizontal axis = Variance Percent. Data value = Average Percent Variance. Mouseover value = OBS Name + Average Variance Percent.
 -
 Part of the Business Transformation collection, this bar-chart portlet displays number of investments per stage. This provides a holistic overview of where the projects are within the organization.
 -
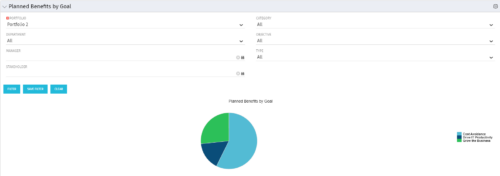 Part of the Business Transformation Package, this pie chart portlet shows planned benefits across the system grouped by Goal. The data is displayed form the investments in a portfolio. The portlet lets the Portfolio Manager know on which GOAL the planned benefit is allocated, so as to target the overall investment spread in the portfolio.
 -
 This portlet shows the variance between the budgeted cost and the planned cost for projects. This allows for the variance to be displayed between what was planned and what was approved. This provides the PMs with the ability to better plan the costs.
 -
 The portlet shows the Overall Status and Budget Status and Amounts. It displays one row per project. The portlet shows the following main fields: Overall Status, Budget Status, Capital Budget, Operating Budget, Total Budget, Capital Planed, Operating Planned, Total Planned, Capital Actuals, Operating Actuals, Total Actuals, Budget Variance ($), Budget Variance (%) Displaying the budget variance allows the PM to understand of the project is over / under spent, and thus the costs planning needs to be re-visited.
 -
 Part of the Business Transformation collection, this line chart portlet displays realized vs planned benefits overtime, for portfolio investments. This provides the PfM with a holistic view of benefits planned vs realized over a period of time.
 -
 The Investment Resource Rate portlet allows a user to search for effective (or missing) rates for resources across all investment types. It pulls rate information from the matrix extraction tables and includes currency conversion if the environment supports multiple currencies. The portlet can be used both to search for the rate of any given resource and to determine which resources might be missing rates when an error is generated when attempting to populate a cost plan (REVMGR-20728:Rates and Costs are both missing for one or more roles/resources).
 -
 By its very nature, the shift to Product Funding is going to require that tracking of that funding. Agile tools do not have much, if any, financial capabilities, so it is important to create an eco-system that can support this value stream—from funding, through delivery, and finally to tracking the realization of financial value. Learn how Rally and Clarity PPM do this very well together.
 -
 This training document is a Rego Consulting Quick Reference Guide to assist with the management of Budget Plans in Clarity’s Modern User Experience. This doc references version 16.1.2 views. Doc provides detail on how to submit a cost plan for approval, how to approve or reject submitted budgets and also provides additional detail on the rules that apply to the submission of budget plans.
 -
 A presentation slide deck from RegoU 2023. This course discussed how IBM’s Turbonomic and Apptio’s Cloudability can work together. Using these two tools will empower your FinOps Organization.
 -
 A presentation slide deck from RegoU 2023. This course covered innovation items that Rego has created to enhance the usability for Apptio.
 -
 Discover how ApptioOne and Targetprocess seamlessly integrate to combine financial and agile processes, creating a unified approach to managing your organization's technology investments. This session will explore the benefits of leveraging both tools to optimize financial management and enhance agile project delivery. Learn how to harness the power of ApptioOne and Targetprocess together to drive efficiency and achieve your organization's goals.
 -
 In the session we will examine the synergy between Apptio and finance applications such as Anaplan, Oracle EPMCS, OneStream, and ClearCost. Discover how Apptio, with its purpose-built IT focus, can enhance organizational planning and workforce management by integrating with finance apps. Join us to learn valuable talking points for TBM Directors and explore real-world examples of successful collaboration between finance apps and Apptio.
 -
 In this session we will explore complex cloud use cases you can manage within ApptioOne, including accruals, forecasting, multi-cloud chargeback, RI waste analysis, and reallocations. Additionally, we will discuss Cloud Business Management reporting and its role in driving accountability, optimizing cloud spend, and creating custom reports for various roles. Join us to learn how ApptioOne can empower you to navigate today's multi-cloud environments and enhance your cloud management strategy.
 -
 Many organizations have a goal to understand, track, and control the TCO of applications or services, but it can be challenging to accomplish. In this session, we'll discuss what makes TCO so important, important decisions you'll need to consider along the way, and some best practice guidance on reaching your TCO goal.
 -
 Discover the growing trend of organizations adopting the FinOps methodology and its integration with the TBM framework. In this session, we'll explore how the TBM office and FinOps teams can collaborate effectively to achieve desired outcomes, fostering a synergistic relationship between them, and leveraging the combined capabilities of Apptio and Cloudability for optimal results.
 -
 Part of the Business Transformation collection, this pie chart portlet displays realized benefit, grouped by category for portfolio investments. It uses System Provider: Portfolio Investment Provider.
 -
 A Quick Reference Guide to assist in entering financial transactions into Clarity’s Classic UX. The guide reviews the basics of transactions entry, create voucher header, entering the line item - details, and entering the line item - transaction.
 -
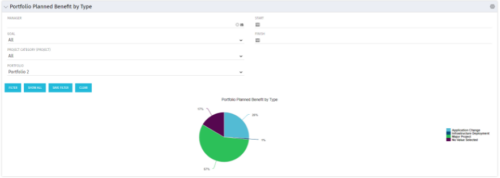 Part of the Business Transformation collection, this pie chart portlet displays realized benefit, grouped by type of project, for portfolio investments. It uses System Provider: Portfolio Investment Provider.
 -
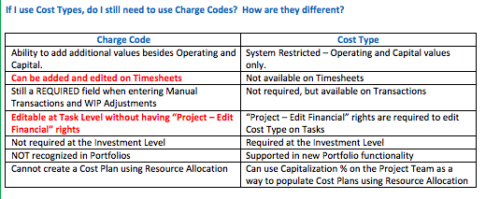 The Cost Type field was introduced in CA PPM 13.3, but had some limitations because it wasn’t available in certain financial areas. The CA PPM 14.3 release includes the addition of Cost Type in the Cost/Rate Matrix, Chargebacks, Transactions and WIP Adjustments. This Technical Trick assists you in moving from Charge Code to Cost Type.
 -
 This training document is a Rego Consulting Quick Reference Guide to assist with Financial Actuals and Reporting in Clarity’s Modern User Experience. This doc references version 16.0.3 views. Document includes detail on which jobs should be run to ensure project and financial data is synchronized with the latest posted actuals. Information is provided on how to analyze cost plans and how to review actual transactions. Instructions are provided on how to analyze budget plans.
 -
 This training document is a Rego Consulting Quick Reference Guide to assist with the management of Budget Plans in Clarity’s Modern User Experience. This doc references version 16.0.3 views. Doc provides detail on how to submit a cost plan for approval, how to approve or reject submitted budgets and also provides additional detail on the rules that apply to the submission of budget plans.
 -
 This training document is a Rego Consulting Quick Reference Guide to assist with transaction entry in Clarity’s Modern User Experience. The document covers transaction entry basics, creating a voucher header, entering line-item details, and entering line detail transactions.
 -
 A Quick Reference Guide to assist with submitting a Cost Plan for Approval in Clarity. Reviews the process while utilizing Clarity’s Classic UX with the Phoenix theme applied.
 -
 A Quick Reference Guide to assist with the creating and managing of Cost Plans in Clarity. The document uses screen shots from the Classic UX using the Phoenix theme.
 -
 A Quick Reference Guide to assist in the creation of Benefit Plans in Clarity’s Classic UX. Reviews the process to access and create the benefit plan, entering benefit details lines, and associating a benefit plan to a cost plan.
 -
 A quick reference card to assist in the creation of a Financial Summary for an investment.
 -
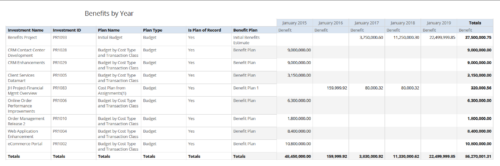 Benefits by year report provides the project manager a single place to view Benefit plan and its associated benefit for various years across multiple projects. Project Managers can use this report to analyze if the projects are giving intended benefits and take appropriate decisions accordingly. User can further narrow their search by OBS Type & Path, Investment Name, Investment Manager, Investment Type, Plan Type and Is Plan of Record?.
 -
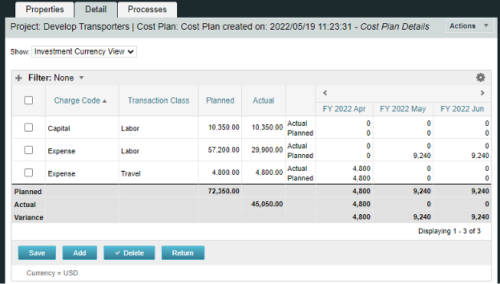
A process creating a new Cost Plan. Cost Plan properties:
Pre-conditions:Name Cost Plan created on: yyyy/mm/dd hh:mm:ss Grouping attributes Charge Code, Transaction Type Start Period The earliest fiscal period with Actuals (from PPA_WIP table) or current period, if there are no actuals Finish Period The latest fiscal period with a non-zero allocation (from PRJ_BLB_SLICES table, SLICE_REQUEST_ID = 6 Period Type Monthly Plan of Record True Planned Cost For periods in the past – from Actuals (Charge Code, Transaction Type, Quantity (Units), Cost (Amount) taken from Transactions (PPA_WIP & PPA_WIP_DETAILS); For current and future periods – from Allocations (Charge Code taken from the Project, Transaction Class from the Resource, Quantity from allocation slices, Cost from the Rate Matrix (NBI_PROJ_RES_RATES_AND_COSTS table) - the Project must be financially enabled.
- if a new Team Member is added, Rate Matrix job must be run, so the rates are populated in the NBI table.
- if the Allocation changes, allow the timeslice job to finish before running the process.
- the Project should have the Charge Code set.
-
 Do you want to report on TCO for your organization by business function, application, or service? This should be the financial management goal of every organization. This class will discuss a path and some architecture choices to make this a reality. We will highlight want some customers are doing today and share some best practices on the journey.
 -
 This Portlet produces a Grid View of Resources using total Resource Allocation from each Project’s Team / Staff, per month; output is expressed as a %. Users can specify which Resource OBS to use as a Filter (unit and descendants is assumed) as well as a Start/End Date.


Copyright 2023 • Rego Consulting Corporation • Privacy Policy