
- Typical Challenges
- Apptio Introduction
- Clarity / Apptio Solution
- Rego’s BETA Integration
-
 A presentation slide deck from Rego University 2022. This document reviews how Clarity and Apptio can work together.
 -
 Do you want to understand Clarity's configuration and functionality for financial management? In this class, you will learn about the OOTB objects, views, and functions of financial plans, rates, and other related areas.
 -
 This training document is a Rego Consulting Quick Reference Guide to assist with the creation of financial plans within Ideas in Clarity’s Modern User Experience. This doc references version 16.2.1 views. Document includes instructions on how to create cost plans, budget plans and benefit plans.
 -
 This portlet shows the project costs by Month. The information displayed includes:
- Start Date for project
- End Date for project
- Budgeted Cost
- Planned Cost
- Actual Hours
-
 This training document is a Rego Consulting Quick Reference Guide to assist with Financial Actuals and Reporting in Clarity’s Modern User Experience. This doc references version 16.0.2 views. Document includes detail on which jobs should be run to ensure project and financial data is synchronized with the latest posted actuals. Information is provided on how to analyze cost plans and how to review actual transactions. Instructions are provided on how to analyze budget plans.
 -
 Does project and idea estimation take too long and lack visibility? This class will address one of the most common pain points within organizations: how to involve the right people within a timely project estimate. Learn Rego’s model for defining, calculating, and modifying idea and project estimates, so you can increase throughput and ROI.
 -
 It is quite common for Rally and Jira to coexist. However, connecting them effectively enhances the value stream for development teams and product owners. Learn what is available to make this happen along with some typical design patterns.
 -
 This Portlet produces a Grid View of Resources using total Resource Allocation from each Project’s Team / Staff, per month; output is expressed as a %. Users can specify which Resource OBS to use as a Filter (unit and descendants is assumed) as well as a Start/End Date.
 -

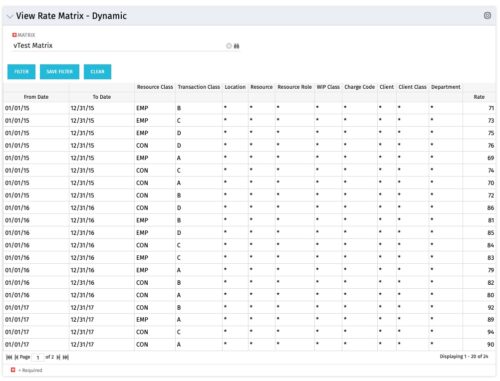 View Rate Matrix is a grid portlet that provides users a single place to view all the rates defined across multiple rate matrix without going to administration tab. Each Matrix may be defined with different columns (ex: Charge Code, Client, Department, Entity, Input type Code etc). This portlet dynamically brings only the columns associated with that rate matrix and provides the detailed information. User can view information related to one matrix at a time.
 -
 Rally Software introduction including high level feature and functionality for Agile and portfolio planning and tracking, analytics and reporting, and overall benefits of Rally in the marketplace along with a product demo.
 -
 Learn about the various techniques and emerging methods companies are taking to capitalize Agile work. You'll learn how some companies are moving away from timesheets and using models based on story points and team rates to generate capitalization reporting.
 -
 This course will focus on the financial setup and processing in Clarity. We'll discuss topics such as financial entities, fiscal periods, financial attributes, and how they all tie back to a labor rate matrix. These components are crucial for calculating labor costs within Clarity and enabling project managers to make financially sound decisions.
 -
 Aligning work to organizational strategy is a fundamental requirement in today's ever-changing marketplace. High performing organizations are moving beyond basic connections to introduce strategic hierarchies that are tied to real measurements of business value via Clarity's Objectives and Key Results (OKRs). Join our expert guides as they present key concepts, best practices, and the evolution of strategic alignment.
 -
 Does your organization own Apptio or looking to purchase it? In this session we will dive into what Apptio is and how it complements your current Clarity solution.
 -
 This training document is a Rego Consulting Quick Reference Guide to assist with the entering of financial transactions in Clarity’s Classic User Experience. This doc references version 16.1.2 views. Document provides basic information on the definition of a transaction and the composition of transaction items. Detail is provided on how to create a new transaction from the Transaction Entry page of the Classic User Experience. Information is provided on how to enter detail into each individual line item for a transaction.
 -
 A presentation slide deck from RegoU 2023. This course was a presentation by Apptio on their Product Roadmap.
 -
This portlet shows the project costs by Month. The information displayed includes:
- Start Date for project
- End Date for project
- Budgeted Cost
- Planned Cost
- Actual Hours
-
 Part of the Business Transformation Collection, this bubble-chart portlet displays investments per their alignment, status and total planned benefit. The: X-axis displays the alignment Y-axis displays the status Bubble-size displays the total planned benefit
 -
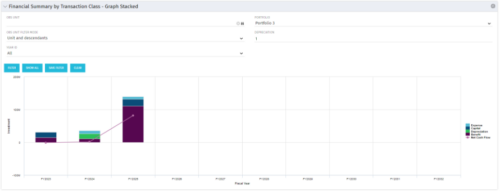 This stacked bar graph portlet displays the financial summary by transaction class for the current and future fiscal annual periods. Filters are provided for:
- OBS
- Portfolio
-
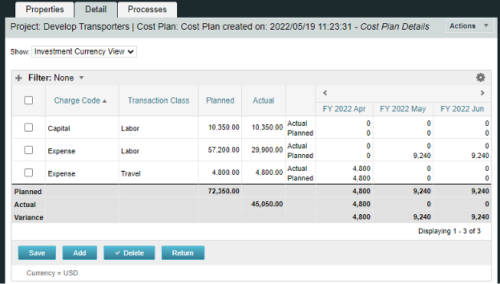
A process creating a new Cost Plan. Cost Plan properties:
Pre-conditions:Name Cost Plan created on: yyyy/mm/dd hh:mm:ss Grouping attributes Charge Code, Transaction Type Start Period The earliest fiscal period with Actuals (from PPA_WIP table) or current period, if there are no actuals Finish Period The latest fiscal period with a non-zero allocation (from PRJ_BLB_SLICES table, SLICE_REQUEST_ID = 6 Period Type Monthly Plan of Record True Planned Cost For periods in the past – from Actuals (Charge Code, Transaction Type, Quantity (Units), Cost (Amount) taken from Transactions (PPA_WIP & PPA_WIP_DETAILS); For current and future periods – from Allocations (Charge Code taken from the Project, Transaction Class from the Resource, Quantity from allocation slices, Cost from the Rate Matrix (NBI_PROJ_RES_RATES_AND_COSTS table) - the Project must be financially enabled.
- if a new Team Member is added, Rate Matrix job must be run, so the rates are populated in the NBI table.
- if the Allocation changes, allow the timeslice job to finish before running the process.
- the Project should have the Charge Code set.
-
 This is an automation to adjust the cost in financials (WIP) based on the standard weekly hours for salaried (Exempt) personnel. The process adjusts only the cost in WIP where the hours per week that are posted for a resource are more than the standard work week. The Posted hours in the timesheet and in WIP remain untouched. For the process to calculate correctly, all time in a given week needs to be accounted for, including all non-project time. The process has three input parameters as explained below:
- wkStdHour: Standard Weekly Hours; this can be changed in the process gel script. The parameter is based on the organization standard work week. The default is set to 40 hours.
- xogBatchSize: The XOG batch size. This is used to upload data in batches to avoid high memory and performance issues. The default batch size is set to 50 records.
- username: The resource name that the process uses for uploading data. The default is set to admin.
- It will process all the timesheets in posted state provided the timesheet has not been adjusted earlier by this process and there are no pending transactions to be posted for it. Validation is made based on Notes field, which is populated once adjustment is done by the process.
- Notes field should not be modified in Script nor should be worked upon by any other process.
- All the invalid transactions should be cleared and post to WIP should be finished with no pending records.
-
 By its very nature, the shift to Product Funding is going to require that tracking of that funding. Agile tools do not have much, if any, financial capabilities, so it is important to create an eco-system that can support this value stream—from funding, through delivery, and finally to tracking the realization of financial value. Learn how Rally and Clarity PPM do this very well together.
 -
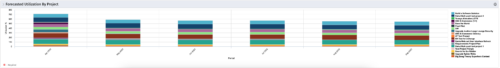 This Portlet produces a Stacked Chart of Projects using total Resource Allocation from each Project’s Team / Staff, per month. Users can specify which Resource OBS to use as a Filter (unit and descendants is assumed) as well as a Start/End Date Range.
 -
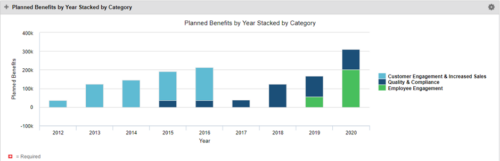 This Portlet starts by pulling Active Investments from a Classic UI Portfolio. It then looks for the Cost Plan of Record and its’ linked Benefit Plan. It then aggregates the Planned Benefit and groups it by Category, then presents a stacked bar chart.
 -
 A review of how Northern Trust integrates financial systems with Clarity PPM bilaterally, providing the Finance organization crucial information, and NT Project Managers with a birds-eye view of project financials. Utilizing the Rego Data Extractor and the Rego Data Processor, these information exchanges help Portfolio and Project Managers eliminate their manual and redundant efforts, solidify their overall data accuracy, and dramatically improve the content provided to their Execs for decision-making.
 -
 Does your organization own Apptio or looking to purchase it? In this session we will dive into what Apptio is and how it complements your current Clarity solution.
 -
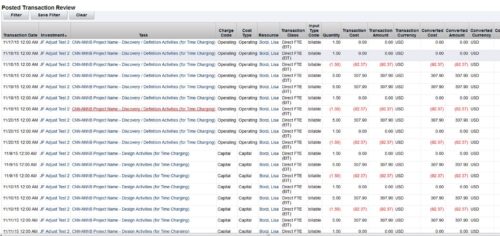
 This training document is a Rego Consulting Quick Reference Guide to assist with Financial Actuals and Reporting in Clarity’s Modern User Experience. This doc references version 16.1.2 views. Document includes detail on which jobs should be run to ensure project and financial data is synchronized with the latest posted actuals. Information is provided on how to analyze cost plans and how to review actual transactions. Instructions are provided on how to analyze budget plans.
 -
 This training document is a Rego Consulting Quick Reference Guide to assist with the creation of Cost Plans in Clarity’s Modern User Experience. Instructions are provided on how to access Cost Plans from the Financials tab and how to create a new Cost Plan. Detail is provided on how to create a cost plan with project information (Populate from Allocations and Populate from Assignments), how to manually enter data into a cost plan and how to set a cost plan as the Plan of Record.
 -
 This training document is a Rego Consulting Quick Reference Guide to assist with the creation of financial plans within Ideas in Clarity’s Modern User Experience. This doc references version 16.1.2 views. Document includes instructions on how to create cost plans, budget plans and benefit plans.
 -
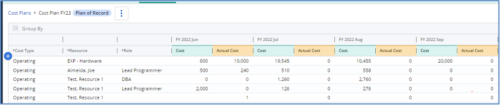
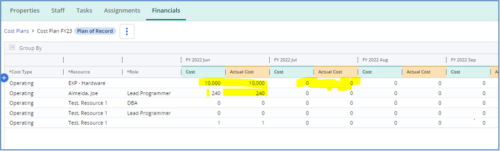 The Populate Prior Periods Forecast From Actuals in Cost Plans process updates Cost Plans for Active Projects, it updates the Forecast for previous months = Posted Actuals, to remove variances from past periods. This is an On Demand process in Clarity named Populate Prior Periods Forecast From Actuals in Cost Plans and can be manually executed from the Organizer or scheduled through the “Execute a Process” job. If there are number of processes in the Organizer – Available Processes, this process can be filtered and then checked to Start. When the process is started it will be seen in the Initiated on the Processes tab. The process status can be monitored from Running to the Completed stage. The process is very flexible and supports Cost Plans with any given grouping and it also works without any dependency on timeslices or other jobs. The process fetches Cost plan of records for all active projects in the system that have Actuals transactions in WIP table. It then process those cost plans to update all of the prior monthly forecast periods with the corresponding monthly Actuals.
 -
The Populate Prior Periods Forecast From Actuals in Cost Plans process updates Cost Plans for Active Projects, it updates the Forecast for previous months = Posted Actuals, to remove variances from past periods. This is an On Demand process in Clarity named Populate Prior Periods Forecast From Actuals in Cost Plans and can be manually executed from the Organizer or scheduled through the “Execute a Process” job. If there are number of processes in the Organizer – Available Processes, this process can be filtered and then checked to Start. When the process is started it will be seen in the Initiated on the Processes tab. The process status can be monitored from Running to the Completed stage. The process is very flexible and supports Cost Plans with any given grouping and it also works without any dependency on timeslices or other jobs. The process fetches Cost plan of records for all active projects in the system that have Actuals transactions in WIP table. It then process those cost plans to update all of the prior monthly forecast periods with the corresponding monthly Actuals.
-
 A presentation slide deck from RegoU 2023. This course covered the process of digital transformation via digital product management. Laureen Knudsen, Broadcom’s Chief Transformation Officer’s presentation deck is available for review.
 -
 Many organizations are moving from a waterfall development approach toward agile methodologies and frameworks. This transformation impacts the financial structure of IT and can create changes in the way the TBM model needs to be built. In this session we will give a high-level overview of what an Agile Business Operating Model is and the potential impacts it could have so you can understand how to integrate this into your TBM practice.
 -
 Do you want to talk to other customers that are using or plan to use financial management? In this moderated Round Table where customers can share experiences and provide insights on process, configurations, challenges, and successes. We will have an expert panel and then divide into small groups and discuss customer selected topics - 100% sharing.
 -
 Have you ever reviewed costs with your stakeholders and suddenly noticed an unexpected change? This class will teach you all the techniques you need to trace down the cause of the discrepancies in the model. We will cover advanced troubleshooting techniques like Metric view for tracing up/down the model and how to leverage model summary reports.
 -
 This training document is a Rego Consulting Quick Reference Guide to assist with the creation of financial plans within Ideas in Clarity’s Modern User Experience. This doc references version 16.0.3 views. Document includes instructions on how to create cost plans, budget plans and benefit plans.
