-

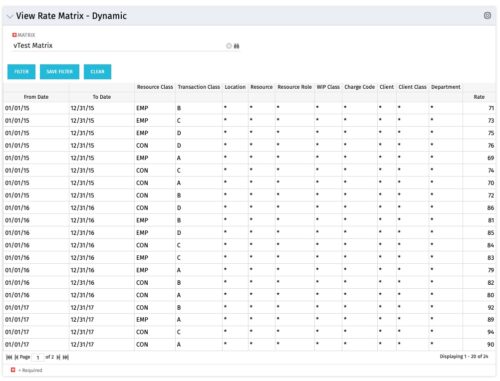 View Rate Matrix is a grid portlet that provides users a single place to view all the rates defined across multiple rate matrix without going to administration tab. Each Matrix may be defined with different columns (ex: Charge Code, Client, Department, Entity, Input type Code etc). This portlet dynamically brings only the columns associated with that rate matrix and provides the detailed information. User can view information related to one matrix at a time.
 -
View Rate Matrix is a grid portlet that provides users a single place to view all the rates defined across multiple rate matrix without going to administration tab. Each Matrix may be defined with different columns (ex: Charge Code, Client, Department, Entity, Input type Code etc). This portlet dynamically brings only the columns associated with that rate matrix and provides the detailed information. User can view information related to one matrix at a time.
-

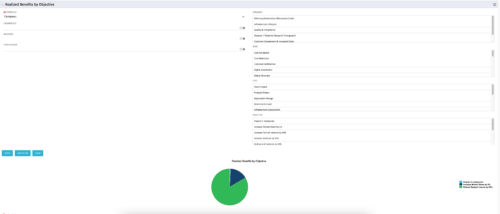 This portlet displays a Pie Chart of a Portfolio’s Realized Benefits partitioned into pie slices by the portfolio’s Investments’ Objectives. Clicking on any pie slice (Objective) drills-down into a portlet that lists the Investments that make up that slice.
 -
This portlet displays a Pie Chart of a Portfolio’s Realized Benefits partitioned into pie slices by the portfolio’s Investments’ Objectives. Clicking on any pie slice (Objective) drills-down into a portlet that lists the Investments that make up that slice.
-
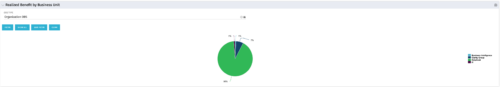 Pie Chart that aggregates Realized Benefit (Total Actual Benefit) by OBS for active projects. Only a Benefit Plan associated with the Cost Plan of Record will return data. The filter allows you to select which OBS filter you prefer to use for this pie chart, however, only an OBS associated with Projects will return data.
 -
Pie Chart that aggregates Realized Benefit (Total Actual Benefit) by OBS for active projects. Only a Benefit Plan associated with the Cost Plan of Record will return data. The filter allows you to select which OBS filter you prefer to use for this pie chart, however, only an OBS associated with Projects will return data.
-
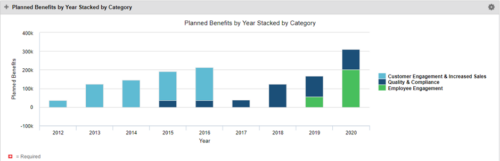 This Portlet starts by pulling Active Investments from a Classic UI Portfolio. It then looks for the Cost Plan of Record and its’ linked Benefit Plan. It then aggregates the Planned Benefit and groups it by Category, then presents a stacked bar chart.
 -
This Portlet starts by pulling Active Investments from a Classic UI Portfolio. It then looks for the Cost Plan of Record and its’ linked Benefit Plan. It then aggregates the Planned Benefit and groups it by Category, then presents a stacked bar chart.
-
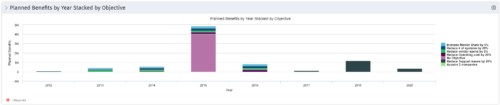 This Portlet starts by pulling Active Investments from a Classic UI Portfolio. It then looks for the Cost Plan of Record and its’ linked Benefit Plan. It then aggregates the Planned Benefit and groups it by Objective, then presents a stacked bar chart.
 -
This Portlet starts by pulling Active Investments from a Classic UI Portfolio. It then looks for the Cost Plan of Record and its’ linked Benefit Plan. It then aggregates the Planned Benefit and groups it by Objective, then presents a stacked bar chart.
-
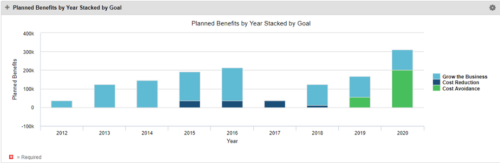 This Portlet starts by pulling Active Investments from a Classic UI Portfolio. It then looks for the Cost Plan of Record and its’ linked Benefit Plan. It then aggregates the Planned Benefit and groups it by Goal, then presents a stacked bar chart.
 -
This Portlet starts by pulling Active Investments from a Classic UI Portfolio. It then looks for the Cost Plan of Record and its’ linked Benefit Plan. It then aggregates the Planned Benefit and groups it by Goal, then presents a stacked bar chart.
-
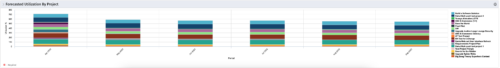 This Portlet produces a Stacked Chart of Projects using total Resource Allocation from each Project’s Team / Staff, per month. Users can specify which Resource OBS to use as a Filter (unit and descendants is assumed) as well as a Start/End Date Range.
 -
This Portlet produces a Stacked Chart of Projects using total Resource Allocation from each Project’s Team / Staff, per month. Users can specify which Resource OBS to use as a Filter (unit and descendants is assumed) as well as a Start/End Date Range.
-
 This Portlet produces a Grid View of Resources using total Resource Allocation from each Project’s Team / Staff, per month; output is expressed as a %. Users can specify which Resource OBS to use as a Filter (unit and descendants is assumed) as well as a Start/End Date.
 -
This Portlet produces a Grid View of Resources using total Resource Allocation from each Project’s Team / Staff, per month; output is expressed as a %. Users can specify which Resource OBS to use as a Filter (unit and descendants is assumed) as well as a Start/End Date.
-
This Portlet produces a Grid View of Resources using total Resource Allocation from each Project’s Team / Staff, per month; output is expressed as a %. Users can specify which Resource OBS to use as a Filter (unit and descendants is assumed) as well as a Start/End Date.
-
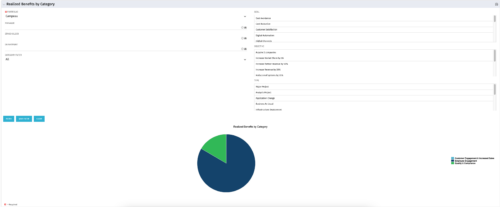 This is a pie chart portlet to show realized benefits across the system by category, including a category for no category or unspecified. Pie chart shows categories of realized benefits in its slices. Available filters:
- Portfolio (required)
- Manager
- Stakeholder
- Department
- Category Filter (default to all)
- Goal
- Objective
- Type
-
This is a pie chart portlet to show realized benefits across the system by category, including a category for no category or unspecified. Pie chart shows categories of realized benefits in its slices. Available filters:
- Portfolio (required)
- Manager
- Stakeholder
- Department
- Category Filter (default to all)
- Goal
- Objective
- Type
-
 The Timesheet Notes portlet displays all timesheet notes split out by resource, investment and task. This is very useful in situations where you want to review multiple notes as you do not have to open each note separately. The table below describes the available filter fields in the portlet.
Column Label Description Timesheet Period Start Range of time periods to display filtered by start date Timesheet Period Finish Range of time periods to display filtered by finish date Resource Resource(s) to display Type Note on a timesheet or time entry (task specific) -
The Timesheet Notes portlet displays all timesheet notes split out by resource, investment and task. This is very useful in situations where you want to review multiple notes as you do not have to open each note separately. The table below describes the available filter fields in the portlet.
Column Label Description Timesheet Period Start Range of time periods to display filtered by start date Timesheet Period Finish Range of time periods to display filtered by finish date Resource Resource(s) to display Type Note on a timesheet or time entry (task specific) -
 This workflow is run as a scheduled or immediate Job to populate Project Cost Plans. It can be configured to run on any desired set of projects. It can be configured to populate the Cost Plan of Record based on Allocations or based on Assignments.
 -
 Have you looked in the regoXchange or reviewed Rego’s innovation offerings? This class will show you the power of Rego’s pre-built content library, integrations, and other assets. See example after example of portlets, processes, and materials you can use to add value to your instance of Clarity. Learn how you can introduce email-based approvals with Rego's action item responder. Get a peek at Rego's new MSP integration that avoids the issues faced with the OOTB integration. Finally, understand Rego's pre-built connectors and how they can benefit your instance. Including blueprint migrator. Include free tools like GEL builder, query, XOGbridge.
 -
 Does your organization own Apptio or looking to purchase it? In this session we will dive into what Apptio is and how it complements your current Clarity solution.
 -
 By its very nature, the shift to Product Funding is going to require that tracking of that funding. Agile tools do not have much, if any, financial capabilities, so it is important to create an eco-system that can support this value stream—from funding, through delivery, and finally to tracking the realization of financial value. Learn how Rally and Clarity PPM do this very well together.
 -
 A review of how Northern Trust integrates financial systems with Clarity PPM bilaterally, providing the Finance organization crucial information, and NT Project Managers with a birds-eye view of project financials. Utilizing the Rego Data Extractor and the Rego Data Processor, these information exchanges help Portfolio and Project Managers eliminate their manual and redundant efforts, solidify their overall data accuracy, and dramatically improve the content provided to their Execs for decision-making.
 -
 Do you want to understand the OOTB configuration and functionality of financial management? In this class, we will review the OOTB objects, views, views, and functions of financial plans, rates, and other related areas. We will cover both classic and new UX highlighting differences.
 -
 Learn about the various techniques and emerging methods companies are taking to capitalize Agile work. You'll learn how some companies are moving away from timesheets and using models based on story points and team rates to generate capitalization reporting.
 -
 It is quite common for Rally and Jira to coexist. However, connecting them effectively enhances the value stream for development teams and product owners. Learn what is available to make this happen along with some typical design patterns.
 -
 Rally Software introduction including high level feature and functionality for Agile and portfolio planning and tracking, analytics and reporting, and overall benefits of Rally in the marketplace along with a product demo.
 -
 Course Description: Do you want to talk to other customers that are using or plan to use financial management? In this moderated round table, customers can share experiences and provide insights on process, configurations, challenges, and successes. We will divide into small groups and discuss customer selected topics—100% sharing.
 -
 Course Description: In the new bimodal IT environment, does your organization lack insights into what Agile work is being done and what value is being delivered? Learn how Apptio Agile Insights merges data from multiple Agile tools, including Clarity PPM, to bring together a total picture of the value IT is delivering.
 -
 Course Description: The single biggest risk for CIOs and IT organizations today is not being able to make good spending decisions at the pace of digital business.
- Challenges
- Investment Planning
- IT Financial Management
- Agile Financials
- ServiceNow ITFM Capabilities
- Apptio Introduction
- ServiceNow / Apptio Solution
- Best Practices
- Pitfalls to Avoid
- Apptio Details


Copyright 2023 • Rego Consulting Corporation • Privacy Policy