-
 Are you starting a demand management implementation? Do you want to compare how you are using these functions vs. how others are using them? In this class, we will discuss some best practices from successful customers.
 -
 Do you want to understand the OOTB configuration and functionality of demand management? In this class, we will review the OOTB objects, views, and functions of ideas, incidents, and other related areas. We will cover both Classic Clarity and the Modern UX, highlighting differences.
 -
 Do you want to talk to other customers that are using or plan to use demand management? In this moderated round table, customers can share experiences and provide insights on process, configurations, challenges, and successes. We will divide into small groups and discuss customer selected topics—100% sharing.
 -
 Funnel Chart displays aggregated counts of Ideas by “Idea Progress”, a custom attribute. Chart shows Idea Progress names in legend, and count total is available as a mouse-over. No filters available on this portlet.
 -
Funnel Chart displays aggregated counts of Ideas by “Idea Progress”, a custom attribute. Chart shows Idea Progress names in legend, and count total is available as a mouse-over. No filters available on this portlet.
-
Funnel Chart displays aggregated counts of Ideas by “Idea Progress”, a custom attribute. Chart shows Idea Progress names in legend, and count total is available as a mouse-over. No filters available on this portlet.
-
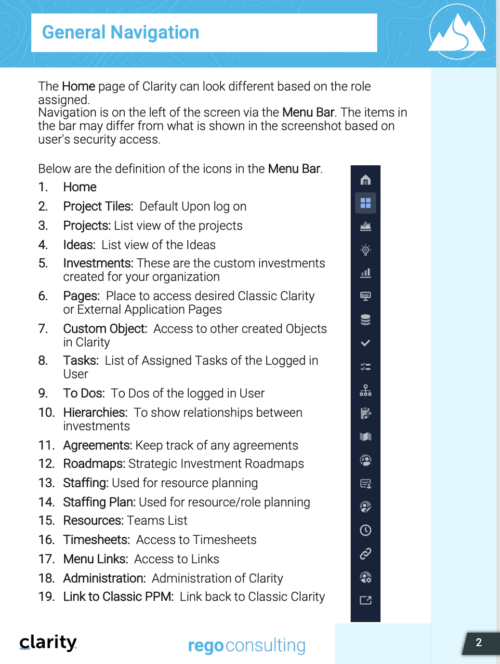
 This training document is a Rego Consulting Quick Reference Guide to assist with General Navigation in Clarity’s Modern User Experience. This doc references version 16.0 views. Doc reviews the Menu Bar and User Tool Bar.
 -
 Every chocolate bar starts as a cocoa bean, just like every project starts as an idea. Clarity was designed as the centralized process that transforms raw ideas into beautifully wrapped, ready-to-launch deliverables. It took a partnership across multiple divisions to ensure success!
 -
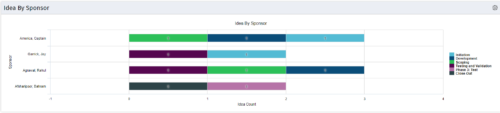 This portlet uses a bar graph to show the count of ideas by stage - grouped by the sponsor OBS. The X-axis displays the count and the Y-axis denotes the sponsor.
 -
This portlet uses a bar graph to show the count of ideas by stage - grouped by the sponsor OBS. The X-axis displays the count and the Y-axis denotes the sponsor.
-
This portlet uses a bar graph to show the count of ideas by stage - grouped by the sponsor OBS. The X-axis displays the count and the Y-axis denotes the sponsor.
-
 A Quick Reference Guide to assist in the creation of Financial Plans for Ideas in Clarity’s Modern UX. In Modern UX you can only create Manual Financial Plans. Go to Classic if you want to create a Cost Plan from Investment Team a Budget Plan or Benefit Plan.
 -
 This training document is a Rego Consulting Quick Reference Guide to assist with setting up financial plans for ideas in Clarity’s Modern User Experience. The document reviews Ideas Cost Plans and Idea Budget Plans.
 -
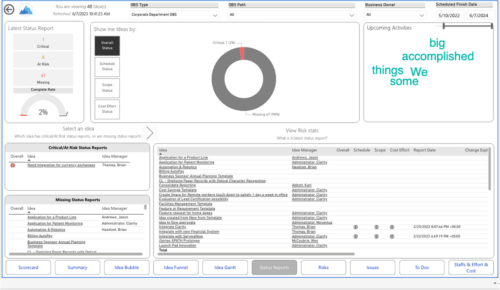
 Part of the Business Transformation collection, this grid portlet displays idea details for all ideas (active and inactive) and all status conditions. This is an editable portlet based on the Ideas data provider. Filterable by OBS structure, Active/Inactive, and Status.
 -
Part of the Business Transformation collection, this grid portlet displays idea details for all ideas (active and inactive) and all status conditions. This is an editable portlet based on the Ideas data provider. Filterable by OBS structure, Active/Inactive, and Status.
-
Part of the Business Transformation collection, this grid portlet displays idea details for all ideas (active and inactive) and all status conditions. This is an editable portlet based on the Ideas data provider. Filterable by OBS structure, Active/Inactive, and Status.
-
 Master your pipeline as you prioritize, visualize, and analyze ideas, assess their feasibility, and track progress from inception to execution. Report Views include: • Idea Bubble • Idea Details • Idea Funnel • Idea Gantt • Idea Overview • Idea Staff and Effort • Idea Status • Idea To Dos Demo Video - https://www.youtube.com/watch?v=xPSxOlrqEq8&list=PLXJ5ktuWV0jiS9CvBpHvBIwpKPmA9uvwK&index=3 The main .rpt file will access data through the Data Warehouse. For clients on Rego’s AWS hosting, we have versions that work with Oracle and Postgres DB and access the live database, if the Rego Odata connector is being used.
 -
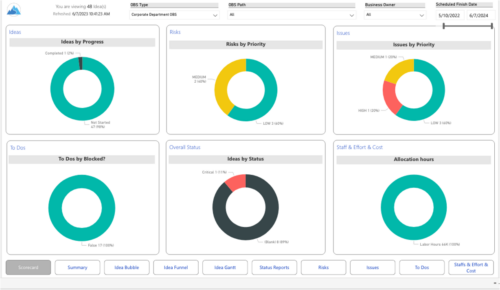 Master your pipeline as you prioritize, visualize, and analyze ideas, assess their feasibility, and track progress from inception to execution. Report Views include:
- Idea Bubble
- Idea Details
- Idea Funnel
- Idea Gantt
- Idea Overview
- Idea Staff and Effort
- Idea Status
- Idea To Dos
-
 Part of the Business Transformation Content collection, this bar chart portlet displays count of ideas per business unit. This provides a holistic view of the idea pipe-line in an organization providing them a high-level of ideas converted, approved, unapproved per business unit.
 -
Part of the Business Transformation Content collection, this bar chart portlet displays count of ideas per business unit. This provides a holistic view of the idea pipe-line in an organization providing them a high-level of ideas converted, approved, unapproved per business unit.
-
Part of the Business Transformation Content collection, this bar chart portlet displays count of ideas per business unit. This provides a holistic view of the idea pipe-line in an organization providing them a high-level of ideas converted, approved, unapproved per business unit.
-
 Ideas by Business Unit report is a pie chart that displays count of ideas per business unit. This report gives a holistic view of the idea pipeline in an Organization and provides information on number of ideas converted, approved & unapproved per business unit. You can further narrow your search by Idea Status, Ideas Start Date and Is Idea Active?.
 -
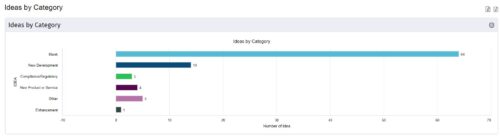
 This is a great way to review demand by type and evaluate where demand is coming from and who will be impacted. Displays a bar graph of all ideas group by type. Provides the ability to drill down into a bar to see which ideas are part of the bar.
 -
This is a great way to review demand by type and evaluate where demand is coming from and who will be impacted. Displays a bar graph of all ideas group by type. Provides the ability to drill down into a bar to see which ideas are part of the bar.


Copyright 2023 • Rego Consulting Corporation • Privacy Policy