-

 The Capacity Graph portlet displays Availability, Allocations, Actuals and Assignments for one or more active resource(s) in a single view. This portlet pulls data from timeslices, and allows the user to filter on a weekly, monthly or quarterly data. The Estimated Time to Complete (ETC) and Allocation data will only show for projects that are active. This portlet provides Resource Managers, PMOs and Executives with a simple way to analyse: Allocations vs. Availability, Allocations vs. Actuals, Allocations vs. ETC and ETC vs. Availability. The graph allows the user to determine where areas of improvement may exist and quickly identify potential areas of constraint. Note: the information displayed is dependent on what the user has security rights to view.
 -
 A presentation slide deck from Rego University 2022. This document reviews the best practices around change and impact management.
- Introduction
- Change and Impact Basics
- How did we get here?
- Demo and Discussion
-
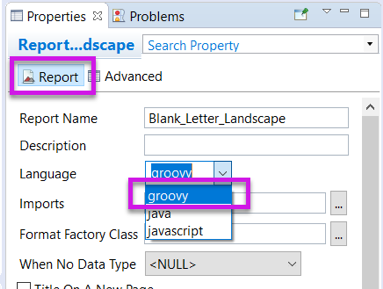 Changing the report programming language can allow the report developer to use other languages (such as Groovy or Javascript) instead of Java methods in expressions. This can be useful in debugging report code.
 -
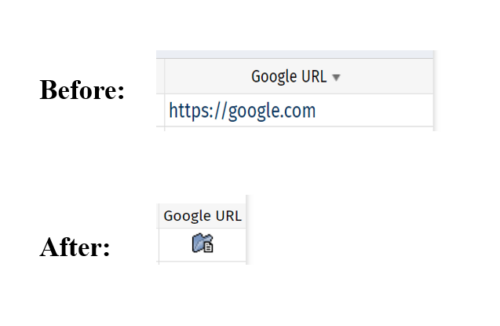 This tech-trick defines how a URL attribute can be changed to an image in a list view via CSS.
 -
 The Changing Application Logo and Title tech trick provides an overview of how to change the logo and title within the application. This allows administrators to rebrand Clarity to their own logo and title. By customizing the logo, employees may be more encouraged to take ownership of the tool.
 -
 Just getting started with Clarity Studio? Join us to learn how to create new objects, CITs, attributes, and lookups in your Clarity environment.
 -
 No matter how hard we try, many organizations cannot pry Excel out of the hands of project and resource managers. In this class we will explore possibilities that give up the battle and embrace Excel as a great data entry tool. We will show some neat case studies on quick Excel integrations deployed at customers.
 -
 Struggling to use an external scheduler like MS Project or Smartsheet with Clarity or investigating its potential? Learn how to effectively use these tools with Clarity in this training, which includes best practices and lessons learned. We will show both OOTB and Rego build connectors that will make the bidirectional connections seamless.
 -
 Are your project teams using SharePoint effectively and getting the most value out of it? Is document management a daily struggle? Learn how to use SharePoint with Clarity in a more seamless way to improve collaboration and team productivity.
 -
 Are your project teams using SharePoint effectively and getting the most value out of it? Is document management a daily struggle? Learn how to use SharePoint with Clarity in a more seamless way to improve collaboration and team productivity.
 -
 A presentation slide deck from Rego University 2022. This document is the course material for the Clarity Advanced Admin class.
- Introduction
- Objects, Attributes and Views/Fields
- Studio and Modern UX
- Introduction to SQL
- Lookups, Queries and Portlets
- Introduction to Workflows (Processes)
- XOG (XML Open Gateway)
- REST API
-
 A presentation slide deck from Rego University 2022. This document is the course material for the Clarity Beginner Admin class.
- Clarity Overview
- Resources and Users
- Objects and Attributes
- Security Setup
- Organizational Breakdown Structures (OBS)
- Intro to Lookups
- Financials Basics
- Scheduling Jobs
-
 A presentation slide deck from Rego University 2021. This course covered:
- Objects, Attributes and Views
- UI Themes and Menu Customization
- Introduction to SQL
- Lookups, Queries and Portlets
- Introduction to Workflow (Processes)
- XOG (XML Open Gateway)
-
 Are you struggling with implementing Agile tools in your organization in addition to Clarity? This class will review best practices for implementing Agile tools in conjunction with Clarity - living in a Bi-Modal world. We will discuss how Clarity can be used to govern both types of work and teams and how Agile tools should interface into Clarity.
 -
 This beginner-friendly course provides an introduction to navigating the application. We'll cover grids, filters, views, and account settings.
 -
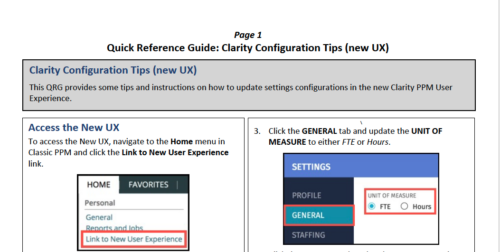 This QRG provides some tips and instructions on how to update settings configurations in the new Clarity PPM User Experience. Covers Accessing the New UX, Update Settings, and Configuring the Grid View.
 -
 This class is a hands-on beginner training class on Clarity's native functionality for reporting. Learn how to build basic visuals/reports and leverage Canvas to get the most out of Clarity.
 -
 Leverage a Kanban or Sprint approach to manage Clarity Implementation and ongoing improvements. List also serves as a history of configuration changes, reasons, and deployment dates.
 -
 Are you struggling with the best way to manage new CA PPM releases? In this class you’ll learn the best practice for testing, release cadence, prioritization, and migration to higher environments. We will review strong business cases and discuss roles and process.
 -
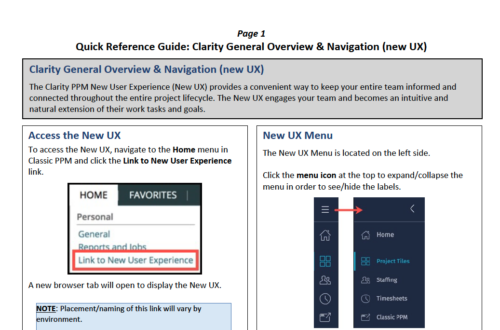 The Clarity PPM New User Experience (New UX) provides a convenient way to keep your entire team informed and connected throughout the entire project lifecycle. The New UX engages your team and becomes an intuitive and natural extension of their work tasks and goals.
 -
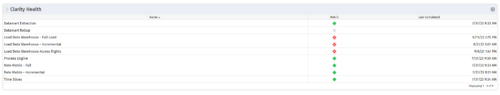 The Clarity Health portlet provides a quick glance into the health of key components and critical jobs in the Clarity environment. The following metrics are monitored: Process Engine Heartbeat should refresh itself every 10 minutes. Process Engine is responsible for the triggering of processes. Green <= 10 Minutes, Yellow 11-15 Minutes, Red > 15 Minutes Time Slices Time Slices are required for accurate reporting. Best practice is for the Time Slicing job to run every minute. Please note there are some jobs that will cause the time slicing to delay so a momentary delay is normal. Green <= 10 Minutes, Yellow 11-15 Minutes, Red > 15 Minutes Datamart Extraction Green <= 24 Hours, Yellow 24-48 hours, Red > 48 hours Datamart Rollup Green <= 24 Hours, Yellow 24-48 hours, Red > 48 hours Rate Matrix - Full Best practice is to run a full rate matrix nightly Green <= 24 Hours, Yellow 24-48 hours, Red > 48 hours Rate Matrix - Incremental Green <= 24 Hours, Yellow 24-48 hours, Red > 48 hours Load Data Warehouse - Full Load Green <= 24 Hours, Yellow 24-48 hours, Red > 48 hours Load Data Warehouse - Incremental Green <= 24 Hours, Yellow 24-48 hours, Red > 48 hours Load Data Warehouse Access Rights Green <= 24 Hours, Yellow 24-48 hours, Red > 48 hours
 -
The Clarity Health portlet provides a quick glance into the health of key components and critical jobs in the Clarity environment. The following metrics are monitored: Process Engine Heartbeat should refresh itself every 10 minutes. Process Engine is responsible for the triggering of processes. Green <= 10 Minutes, Yellow 11-15 Minutes, Red > 15 Minutes Time Slices Time Slices are required for accurate reporting. Best practice is for the Time Slicing job to run every minute. Please note there are some jobs that will cause the time slicing to delay so a momentary delay is normal. Green <= 10 Minutes, Yellow 11-15 Minutes, Red > 15 Minutes Datamart Extraction Green <= 24 Hours, Yellow 24-48 hours, Red > 48 hours Datamart Rollup Green <= 24 Hours, Yellow 24-48 hours, Red > 48 hours Rate Matrix - Full Best practice is to run a full rate matrix nightly Green <= 24 Hours, Yellow 24-48 hours, Red > 48 hours Rate Matrix - Incremental Green <= 24 Hours, Yellow 24-48 hours, Red > 48 hours Load Data Warehouse - Full Load Green <= 24 Hours, Yellow 24-48 hours, Red > 48 hours Load Data Warehouse - Incremental Green <= 24 Hours, Yellow 24-48 hours, Red > 48 hours Load Data Warehouse Access Rights Green <= 24 Hours, Yellow 24-48 hours, Red > 48 hours


Copyright 2023 • Rego Consulting Corporation • Privacy Policy