-
 This training document is a Rego Consulting Quick Reference Guide to assist with the updating, synchronizing and deleting of Roadmap investments in Clarity’s Modern User Experience. This doc references version 16.1 views. Detail is provided on how to update individual Roadmap items within the Grid View, Timeline View and Board View. Included are instructions on how to synchronize Roadmap investments and how to delete an investment from a Roadmap.
 -
 A presentation slide deck from Rego University 2022. The course outline for creation of Power BI Dashboards for Clarity, Beginner Level.
- Overview
- Connecting to Data Sources
- Reports and Dashboards
- Creating a Report
- Data Import Options
- Data Transformation
-
 A presentation slide deck from Rego University 2022. This document reviews best practices for Demand Management.
- Define Demand for your organization
- Support the Planning business process directly in Clarity
- Think through the process to standardize forms and required data – from capturing the data to leveraging it in views, Roadmaps, Hierarchies and/or reports
- Identify and engage Users and Consumers
- Keep it simple: Understand expected business outcomes when defining required fields, and eliminate everything that isn’t necessary
-
 A presentation slide deck from Rego University 2022. The document reviews the best practices around annual planning for your Clarity instance.
- Introduction
- Annual Planning Basics
- Clarity in Annual Planning
- Investment Tracking
- Resource Planning
- Financial Tracking
- Prioritization
-
 A presentation slide deck from Rego University 2022. The document reviews the process to follow post tool implementation.
- Typical Post-Implementation / Operational Challenges
- Aspirations for and Outcomes of a High Performing Ownership Team
- Model Solution:
- Roles and Responsibilities
- Intake, Triage, and Delivery Process
- Clarity Board-Based Solution
-
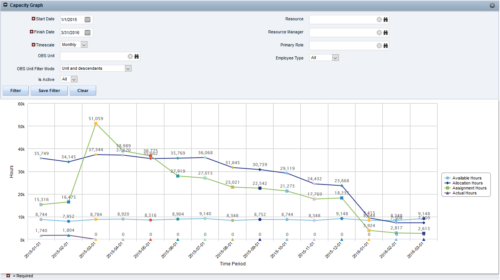
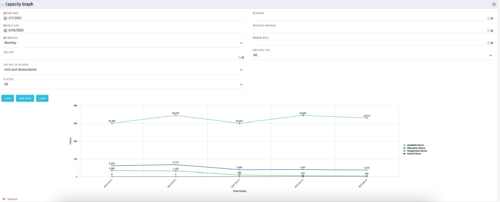 The Capacity Graph portlet displays Availability, Allocations, Actuals and Assignments for one or more active resource(s) in a single view. This portlet pulls data from timeslices, and allows the user to filter on a weekly, monthly or quarterly data. The Estimated Time to Complete (ETC) and Allocation data will only show for projects that are active. This portlet provides Resource Managers, PMOs and Executives with a simple way to analyse: Allocations vs. Availability, Allocations vs. Actuals, Allocations vs. ETC and ETC vs. Availability. The graph allows the user to determine where areas of improvement may exist and quickly identify potential areas of constraint. Note: the information displayed is dependent on what the user has security rights to view.
 -
The Capacity Graph portlet displays Availability, Allocations, Actuals and Assignments for one or more active resource(s) in a single view. This portlet pulls data from timeslices, and allows the user to filter on a weekly, monthly or quarterly data. The Estimated Time to Complete (ETC) and Allocation data will only show for projects that are active. This portlet provides Resource Managers, PMOs and Executives with a simple way to analyse: Allocations vs. Availability, Allocations vs. Actuals, Allocations vs. ETC and ETC vs. Availability. The graph allows the user to determine where areas of improvement may exist and quickly identify potential areas of constraint. Note: the information displayed is dependent on what the user has security rights to view.
-
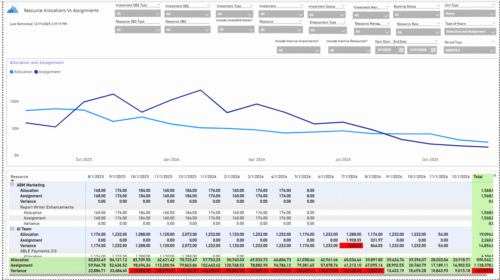 The Allocations and Assignments report displays resource assignments and allocations across multiple projects. This report will provide a single view of the assigned data for all assignments across multiple projects in-line with their allocations. The data is displayed by monthly periods. The horizontal and vertical sums provide a cumulative picture resource wise and month wise respectively. Filters provide the user the ability to monitor data across multiple projects. Filters include investment type, investment, resource, active/inactive resource or investment along with OBS type and OBS unit. If multiple projects are utilizing the same resource, the PM or RM can filter for assignments/allocations utilizing that specific resource to prevent over-allocations or under-allocations.
 -
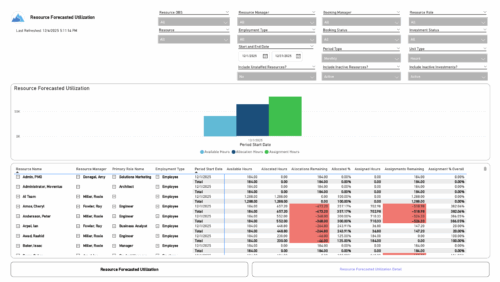 The Resource Forecasted Utilization report provides a high-level view of resource workload by displaying availability, allocation, and assignment amounts over time. Data can be viewed weekly, monthly, or in total, helping teams understand capacity and forecasted demand. Values are shown in either hours or full-time equivalents (FTEs), making it easy to compare utilization across resources and time periods.
 -
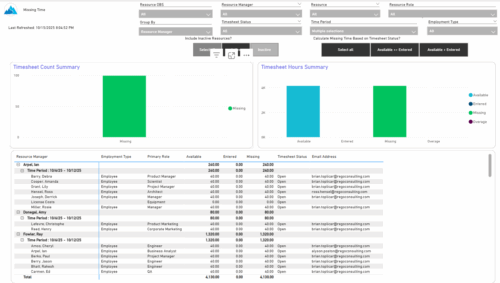 The Missing Time report provides insight into timesheet compliance by comparing available hours, entered hours, and missing hours for each resource over a selected time period. It can be grouped by resource manager or OBS level and offers flexibility to calculate missing time based on timesheet status or resource availability. The report includes summary charts showing timesheet completion rates and total hours, highlighting completed, partial, and missing timesheets as well as overages across reporting periods.
 -
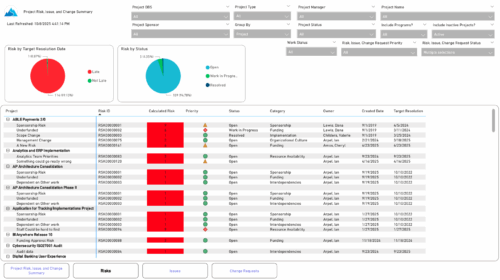 The Project Risk, Issue, and Change Summary report provides an overview of project health by visualizing risks, issues, and change requests. It includes pie charts that display counts by target resolution or expected close date, as well as by status. A detailed table lists each item’s name, ID, priority, status, category, owner, creation date, and resolution or close date. Results can be grouped by project or viewed without grouping to support flexible analysis and tracking.
 -
 The Resource Time Review by Manager report provides visibility into timesheet entries for each resource, organized by investment manager or resource manager. It details hours entered by day and in total for each investment and time entry, helping managers monitor time allocation and utilization across their teams. This report supports effective oversight of resource effort and project participation.


Copyright 2023 • Rego Consulting Corporation • Privacy Policy