-
 Prosci presents an AI Adoption Workshop with a focus on getting a ROI on your investment in AI.
 -
 Annual planning shouldn’t be an Excel nightmare—or disconnected from strategy. In this session, see how one organization used Strategic Portfolio Management (SPM) with Clarity to transform their budgeting process from reactive to strategic.
 -
 Value Stream Management (VSM) isn’t just another buzzword; it’s the visibility layer your digital transformation is starving for. In this session, learn how to map, measure, and maximize value across the entire delivery lifecycle.
 -
 Prosci presents concepts on changing Portfolio Management. They share their approach on the people side of PfM, with a goal of addressing the saturation and collision of multiple projects, initiatives or work efforts.
 -
 Aligning work to organizational strategy is a fundamental requirement in today's ever-changing marketplace. High performing organizations are moving beyond basic connections to introduce strategic hierarchies that are tied to real measurements of business value via Clarity's Objectives and Key Results (OKRs). Join our expert guides as they present key concepts, best practices, and the evolution of strategic alignment.
 -
 Take your Resource Planning to the next level with itDesign’s Advanced Resource Planning add-on for Clarity.
 -
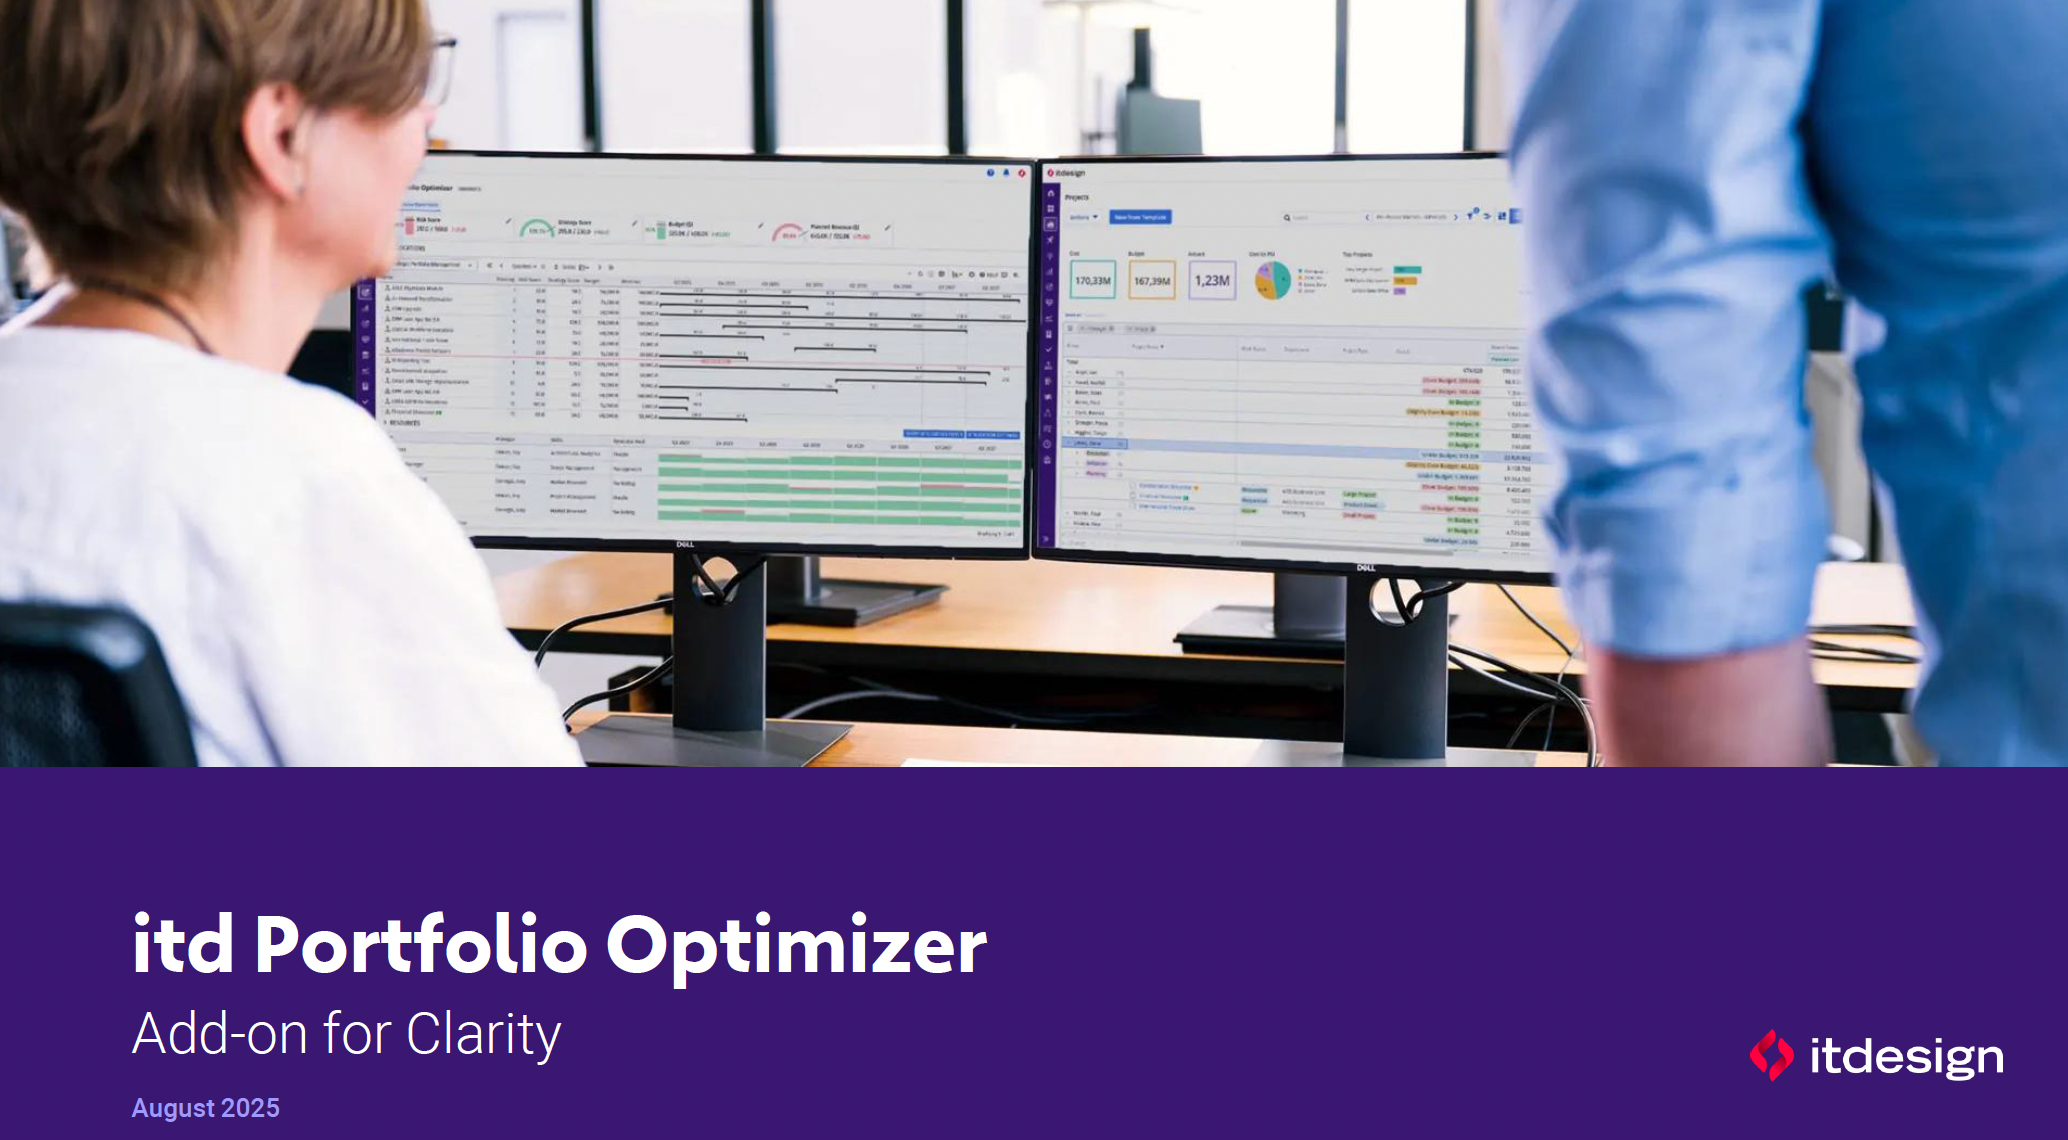 ItDesign has a new Clarity Add-on for portfolio management. In this class they will introduce the Portfolio Optimizer.
 -
 Clarity’s new reporting capabilities deliver interactive insights directly within the platform—no data exports required. In this session, you’ll learn how to harness the latest reporting features to empower decision-makers, visualize portfolio performance, and tell compelling stories with your data.
 -
 This session dives into the impact of misaligned data between planning and delivery systems—and what it costs your organization in rework, delays, and missed opportunities. Learn how connecting Clarity and Jira enables real-time synchronization between portfolio planning and Agile execution, giving CIOs the visibility, traceability, and confidence to drive outcomes—not just activity.
 -
 Looking to automate some tasks within your Clarity environment? This class will guide you through Clarity's workflow engine, covering instance vs. general processes, start options, action types, pre and post conditions, MUX workflows, and notifications.
 -
 This course will introduce fundamental programming concepts like variable assignment, conditional statements, and loops. The class will be taught in GEL and will build a solid foundation for future programming skills.
 -
 This introductory course will teach students how to query the Clarity database using SQL. We will discuss different methods to query the database, the basics of SQL, and the Clarity data model.
 -
 Demystify GEL scripts and learn best practices for GEL script development and maintenance. We'll discuss code formatting, comments, pros and cons of various GEL tags, and any other topics that have been on your mind. With several instructors we can break into smaller groups to ensure we answer all of your specific questions including advanced use cases like notifications, querying the database, etc.
 -
 In this course we'll go beyond the basics of SQL and focus on writing clean, efficient, and scalable queries. We'll cover industry-standard best practices for structuring SQL code, optimizing performance, using functions, and working with large datasets in a maintainable way.
 -
 This round table discussion will focus on Clarity configurations using Studio. A well-configured Clarity environment will minimize performance bottlenecks, ease development, and increase end user adoption. Join us to discuss best practices around object structure, naming conventions, audit trail settings, and more.
 -
 Just getting started with Clarity Studio? Join us to learn how to create new objects, CITs, attributes, and lookups in your Clarity environment.
 -
 This beginner-friendly course provides an introduction to navigating the application. We'll cover grids, filters, views, and account settings.
 -
 This class is a hands-on beginner training class on Clarity's native functionality for reporting. Learn how to build basic visuals/reports and leverage Canvas to get the most out of Clarity.
 -
 Want to keep your Clarity environment running efficiently? In this class we'll discuss how to maintain your Clarity environment through the use of jobs, processes, and configuration. We'll also cover recommended maintenance activities to ensure your environment is running optimally.
 -
 Tired of repeating the same code in your GEL scripts? Prefer not to write thirty lines just to call a REST web service? Learn tips and tricks for reusing code—like using <include> tags and Rego’s Jam Tags solution to simplify and streamline your scripts. In this session, you'll learn the functionality and advantages to using Jam Tags within your GEL scripts to accomplish tasks that were tedious, error prone, and in some cases impossible within GEL.
 -
 This course will focus on the financial setup and processing in Clarity. We'll discuss topics such as financial entities, fiscal periods, financial attributes, and how they all tie back to a labor rate matrix. These components are crucial for calculating labor costs within Clarity and enabling project managers to make financially sound decisions.
 -
 Discover Rego's integration tools that are specifically built to help develop and standardize the integration process. Learn about Rego's Data Extractor - a highly configurable and efficient tool to extract Clarity data into flat files. And also Rego's Data Processor - a highly configurable tool that abstracts the most common development tasks for an inbound integration. We'll review both tools and discuss integration best practices.
 -
 This course will take a deep dive into Modern UX administration. We'll cover the advanced MUX Administration settings, managing system wide views before deep diving into advanced blueprints topics such as visuals, modules, rules, and actions.
 -
 This beginner-friendly course will cover basic administration within Modern UX. You'll learn about enabling MUX, establishing your System Settings, and Blueprints basics.
 -
 This course will take a deeper dive into Clarity portlets. We'll take the next step after configuring object based portlets, and learn how to write an NSQL query to provide data to your portlet. We'll cover different types of portlets, grids, graphs, and multi-dimensional portlets, demonstrate how to surface the portlet on a page, and channel to it from Modern UX. Including HTML portlets and scripting tips.
 -
 Utilize Power BI with the Clarity ODATA connector to get critical data for rich reports and dashboards. This class is a hands-on beginner training for Power BI. learn how to build basic visuals and reports against the Clarity data warehouse.
 -
 This beginner-friendly course will begin exploring project management related themes and how they translate to Clarity. We'll discuss resources and calendars that demonstrate resource availability, and project teams which represent demand against your resources.
 -
 Take a deep dive into Clarity's REST APIs. You will learn different ways to explore Clarity's API's using the REST API explorer, Postman, and Chrome's Developer Tools. We will cover HTTP methods, status codes, Clarity-specific headers, and creating and parsing JSON.
 -
 Join us to discuss one of the most important - but also one of the most confusing Clarity topics - security. Learn how an OBS can be utilized to control security, how security permissions can be granted and revoked, and the pros and cons of the different types of security permissions.
 -
 Join us for a round table discussion on advanced SQL. We'll discuss sub-queries, common table expressions (CTE's), analytic functions, and any other requested topics. With multiple instructors we can break out into smaller groups for a more targeted experience.
 -
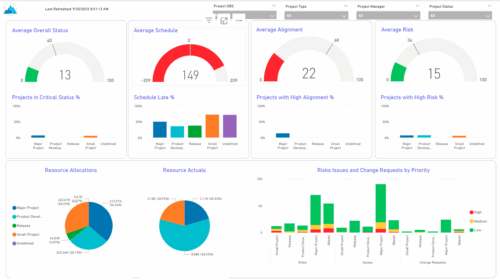 The KPIs by Project Type (Dashboard) report provides visibility into key project health measures, including status, schedule, alignment, and risk. Gauge visuals highlight each KPI at a summary level, while column charts break down results by project type. Resource allocation and actual hours are summarized in pie charts, making it easy to compare utilization across project types. In addition, bar charts display the number of issues, risks, and change requests by project type and priority, helping teams quickly identify areas of concern.
 -
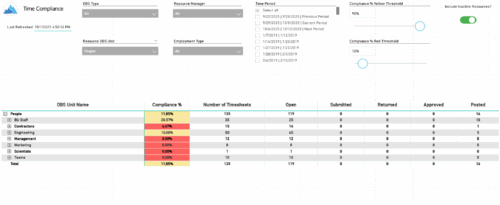 The Time Compliance report displays the timesheet compliance percent, the number of timesheets by status (open, submitted, returned, approved, and posted), and the total for each OBS unit, with the ability to filter and drill down.
 -
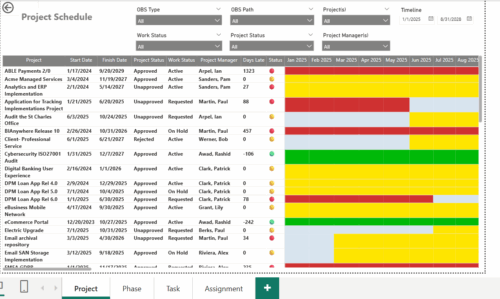 The Project Schedule report provides visibility into project schedule, including detailed information on days late, status and its associated items such as detailed info of schedule on Phase level, Task level and assignment level. Results are grouped by project in Phase, Task and assignment sections or can be viewed without grouping to support flexible analysis for projects. Interactive visuals make it easy to track, monitor, and manage schedule across projects.
 -
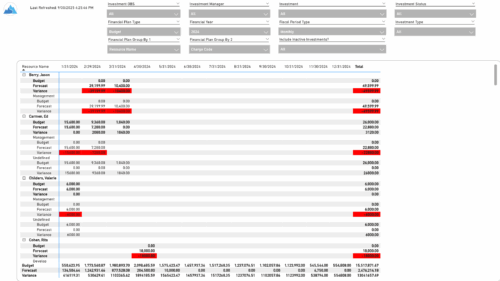 The Financial Budget vs. Forecast by Period report provides insight into financial performance by comparing planned or budgeted costs against forecasted costs across defined time periods. It highlights period-level and total variances to help identify trends and deviations. Results can be grouped by up to two financial attributes, such as Charge Code, Cost Type, Department, Input Type, Location, Resource, Resource Class, Role, Transaction Class, or User Values 1 and 2, allowing flexible analysis by key dimensions.
 -
 The Financial Budget vs. Forecast by Period Detail report provides a detailed breakdown of planned or budgeted costs compared to forecasted costs by investment. It displays variances for each period and in total. Users can filter or drill down to view the specific investments that contribute to selected financial plan groupings.
 -
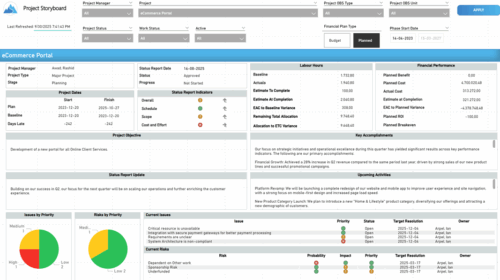 The Time Compliance report displays different frame in the displaying project information such as project dates, project objective, the amount, and cost of resources that are planned and actual, key accomplishments, upcoming activities, current issues and risks, and the project progress toward goals, and some EVM indicators for its phases.


Copyright 2023 • Rego Consulting Corporation • Privacy Policy