RegoXchange
  • The 
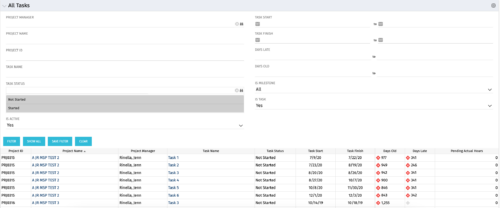
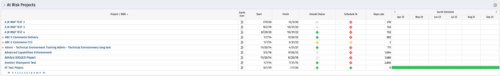
All Tasks portlet displays all tasks related to active projects that the logged in user has view rights to.  The portlet provides the project manager a single place to view tasks across multiple projects without having to go into each project individually, and allows for more efficient management and reporting across projects. The portlet displays project actuals and estimates from the project (datamart tables). The portlet allows analysis like:
    • PMs may have several critical tasks that were supposed to start on a certain date.  To verify progress, they filter for that start date to perform a review of the tasks.
    • PMs can review days late to see how tasks are doing against the baseline date (<7 days is green, 7-14 is yellow, and >14 is red)
    • PMs can review days old to see how tasks are doing against today’s date (<7 days is green, 7-14 is yellow, and >14 is red)
    The table below describes the available columns in the portlet. The first 10 are configured in the default view:
    Column Label Description
    Project ID Unique project identifier
    Project Name Name of the project
    Project Manager Manager of the project
    Task Name Name of the task
    Task Status Not Started, Started, or Completed
    Task Start Start Date of this task
    Task Finish Finish Date of this task
  • This view depicts Allocation Compliance for resources grouped by OBS.  Using the daily Resource Availability and Daily Resource Allocation Time Slices this column chart groups aggregate Allocation vs Availability by OBS Unit.  The chart allows quick analysis to see if resources are adequately allocated (between 80% to 120% of their capacity) or if they are significantly under or over allocated. NOTE:  The grouping of OBS unit is limited to 1 level below the selected OBS in the portlet filter.
  • This view depicts Allocation Compliance for resources grouped by OBS.  Using the daily Resource Availability and Daily Resource Allocation Time Slices this column chart groups aggregate Allocation vs Availability by OBS Unit.  The chart allows quick analysis to see if resources are adequately allocated (between 80% to 120% of their capacity) or if they are significantly under or over allocated. NOTE:  The grouping of OBS unit is limited to 1 level below the selected OBS in the portlet filter.
  • This view depicts Allocation Compliance for resources grouped by OBS.  Using the daily Resource Availability and Daily Resource Allocation Time Slices this column chart groups aggregate Allocation vs Availability by OBS Unit.  The chart allows quick analysis to see if resources are adequately allocated (between 80% to 120% of their capacity) or if they are significantly under or over allocated. NOTE:  The grouping of OBS unit is limited to 1 level below the selected OBS in the portlet filter.
  • The Allocation Compliance Pie Chart portlet gives a view of active resources' allocation compliance within a date range and OBS displayed in a pie chart.  It allows the user to the percentage of resources over, under, and adequately staffed on projects over a selected time period.   This portlet leverages the daily allocation and daily availability slices as well as only active investments.  The portlet provides filters for specific dates (required) and OBS.
  • The Allocation Compliance Pie Chart portlet gives a view of active resources' allocation compliance within a date range and OBS displayed in a pie chart.  It allows the user to the percentage of resources over, under, and adequately staffed on projects over a selected time period.   This portlet leverages the daily allocation and daily availability slices as well as only active investments.  The portlet provides filters for specific dates (required) and OBS.
  • The Allocation Compliance Pie Chart portlet gives a view of active resources' allocation compliance within a date range and OBS displayed in a pie chart.  It allows the user to the percentage of resources over, under, and adequately staffed on projects over a selected time period.   This portlet leverages the daily allocation and daily availability slices as well as only active investments.  The portlet provides filters for specific dates (required) and OBS.
  • Evaluate resource allocations, identify bottlenecks, and ensure optimal resource utilization across projects and teams. Report Views include: • Over Allocation • By Project • By People • Project Resource Details • No Allocations by Project • No Allocations by People The main .rpt file will access data through the Data Warehouse.
  • Evaluate resource allocations, identify bottlenecks, and ensure optimal resource utilization across projects and teams. Report Views include: • Over Allocation • By Project • By People • Project Resource Details • No Allocations by Project • No Allocations by People The main file will access data through custom queries created via Rego Odata connector.
  • Lean Portfolio Management (LPM) is one of the seven SAFe components of the Lean Enterprise. LPM helps organizations solve numerous challenges by decreasing the delivery of time to value, enabling the organization to pivot quickly in ever-shifting markets, and more.
  • Annual planning shouldn’t be an Excel nightmare—or disconnected from strategy. In this session, see how one organization used Strategic Portfolio Management (SPM) with Clarity to transform their budgeting process from reactive to strategic.
  • A presentation slide deck from Rego University 2022.   The document reviews the best practices around annual planning for your Clarity instance.
    • Introduction
    • Annual Planning Basics
    • Clarity in Annual Planning
    • Investment Tracking
    • Resource Planning
    • Financial Tracking
    • Prioritization
  • Course Description:   Does your organization want to implement application portfolio management (APM)? Are you trying to determine the value in implementing APM? Are you struggling to know what tool you should use and what data is important to collect? This session will review specific use cases of companies that have implemented APM and effectively used the data to drive value for the organization.
  • Course Description:  A review of the basics around APM.  Covering Business Capabilities, Application Scoring, and Best Practices.
  • A Quick Reference Card to assist in the approving/rejecting of Ideas.  Included converting Ideas once approved.
  • This training document is a Rego Consulting Quick Reference Guide to assist with timesheet approval in Clarity’s Modern UX.  The doc reviews Accessing and Selecting Timesheets, Reviewing Submitted Timesheets, Approving Timesheets, Returning Timesheets and the Timesheet Grid.
  • A presentation slide deck from RegoU 2023.  This course was a presentation by Apptio on their Product Roadmap.
  • Does your organization own Apptio or looking to purchase it?  In this session we will dive into what Apptio is and how it complements your current Clarity solution.
  • Does your organization own Apptio or looking to purchase it? In this session we will dive into what Apptio is and how it complements your current Clarity solution.
  • Does your organization own Apptio, or are you looking into purchasing it? In this session, we will dive into what Apptio is and how it can complement your current Clarity solution.
  • A presentation slide deck from Rego University 2022.   This document reviews how Clarity and Apptio can work together.
    • Typical Challenges
    • Apptio Introduction
    • Clarity / Apptio Solution
    • Rego’s BETA Integration
  • A presentation slide deck from Rego University 2022.   This deck reviews Apptio’s self-service reporting tool.  This tool is geared towards end users and empowers them to create and share their own reports.
  • Learn how Apptio BI, an intuitive ad-hoc reporting solution, serves as a one-stop shop for custom data needs, saving time and energy for TBMAs. This hands-on session will guide you through setting up Apptio BI, discuss best practices for deployment, and demonstrate how it unifies the best aspects of ApptioOne and Cloudability for a holistic understanding of IT spend. Master the fundamentals of creating an Apptio BI dashboard and optimize your IT financial management experience.
  • Discover the secrets to fine-tuning your ApptioOne model's performance by learning about common issues and their resolutions. This session covers model reviews to ensure accurate cost representation, optimization strategies for your ApptioOne environment, and how to effectively utilize the Apptio Performance Component. Enhance your skills and improve your model's overall efficiency with the valuable insights shared in this session.
  • A presentation slide deck from RegoU 2023.  This course reviewed the abundant ways to document information within Apptio.
  • Set yourself up for success in IT planning by learning the ins and outs of Apptio's ITP. We will cover tips and tricks, best practices, and ways to use ITP to push your organization to the next level.
  • A presentation slide deck from Rego University 2022.   This class reviewed Apptio reporting options, tips & tricks, etc.
    • Introduction
    • Reporting Options for Apptio
    • Reporting Tips & Tricks
    • Reporting best practices
    • Custom Report Showcase
  • Reporting is typically the only interaction executives, and stakeholders have with Apptio, so reports should be pristine. In this session, we will show you how to improve your Apptio reporting, making it more visually appealing, intuitive, and digestible. We'll give you some tips on how to make your reporting in Apptio pop out like conditional highlighting, leveraging html components, layout and design techniques.
  • A presentation slide deck from Rego University 2022.   An outline of topics used for a Apptio Round-Table discussion.
  • This process grants Project Management instance rights to all of the project team members within the program hierarchy.  Allows users to view management properties, roster and key tasks of the project.  This also allows user view access to the project in Microsoft Project.
  • This process grants Project Management instance rights to all of the project team members within the program hierarchy.  Allows users to view management properties, roster and key tasks of the project.  This also allows user view access to the project in Microsoft Project.
  • This process grants Project Management instance rights to all of the project team members within the program hierarchy.  Allows users to view management properties, roster and key tasks of the project.  This also allows user view access to the project in Microsoft Project.
  • Part of the Business Transformation collection, this bar-chart portlet displays investments and (if exists) any child investments, which are at risk with regard to the schedule of the investments.
  • Part of the Business Transformation collection, this bar-chart portlet displays investments and (if exists) any child investments, which are at risk with regard to the schedule of the investments.
  • Discover how to utilize Datalink and its expanding range of system integration connectors to automate data processing and streamline your TBM processes. This session will cover tips and tricks for efficient month-end processing, testing, and validation, as well as delve into the use of Datadrop, integration with ITP, and API implementation. Enhance your TBM experience by mastering automation and streamlining techniques.
  • Has your organization made significant investments in technology solutions without seeing precise results? Do you have the right capabilities yet lack a vibrant and interconnected end-to-end solution? Come to this session to learn more about the importance of a living strategic roadmap and how Rego's Digital Ecosystem Assessment program can help. This session will review the key elements needed to create an effective roadmap that can help optimize your digital ecosystem, drive increased maturity, and increase engagement within your organization.
Go to Top