-
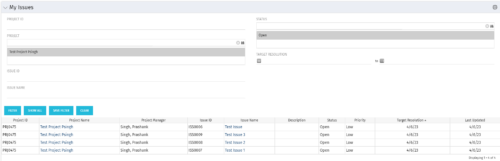 The My Issues portlet displays all issues within active project that the logged in user is assigned to. The portlet provides the logged in user a single place to view issues across multiple projects without having to go into each project individually. The filter then allows the user to narrow their search by Issue ID, Issue Name, Project ID, Project Name, and Issue Status. You may also narrow the view to display issues with a target resolution date within a certain date range.
 -
The My Issues portlet displays all issues within active project that the logged in user is assigned to. The portlet provides the logged in user a single place to view issues across multiple projects without having to go into each project individually. The filter then allows the user to narrow their search by Issue ID, Issue Name, Project ID, Project Name, and Issue Status. You may also narrow the view to display issues with a target resolution date within a certain date range.
-
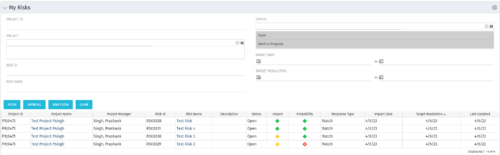 The My Risks portlet displays all risks related to active projects that the logged in user has been assigned as the owner. The portlet provides the logged in user a single place to view risks across multiple projects without having to go into each project individually. The filter then allows the user to narrow their search by Risk ID, Risk Name, Project ID, Project Name, and Risk Status. You may also narrow the view to display issues with a target resolution date or impact date within a certain date range.
 -
The My Risks portlet displays all risks related to active projects that the logged in user has been assigned as the owner. The portlet provides the logged in user a single place to view risks across multiple projects without having to go into each project individually. The filter then allows the user to narrow their search by Risk ID, Risk Name, Project ID, Project Name, and Risk Status. You may also narrow the view to display issues with a target resolution date or impact date within a certain date range.
-
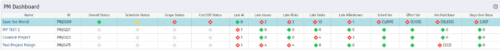 The PM Dashboard portlet provides an overview of all projects for which the user is the Project Manager without navigating to and opening each project individually. All critical information related to the project status is displayed in this portlet. Status indicators display the project’s statuses. Graphical stoplights and numbers provide an overview of all late Action items, Issues, Risks, Tasks, and Milestones.
 -
The PM Dashboard portlet provides an overview of all projects for which the user is the Project Manager without navigating to and opening each project individually. All critical information related to the project status is displayed in this portlet. Status indicators display the project’s statuses. Graphical stoplights and numbers provide an overview of all late Action items, Issues, Risks, Tasks, and Milestones.
-
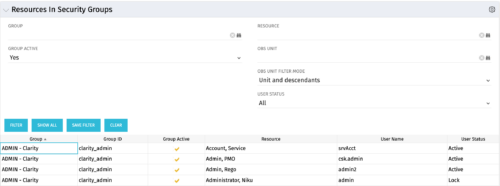 The Resources in Security Groups portlet shows security group information for resources. (Note: the information displayed is dependent on what the user has security rights to view.) The portlet displays the Group, Group ID, if the Group is active, Resource, User Name and User Status. This portlet also includes the ability to filter on a specific group or resource, by whether the group is active, by user status or OBS.
 -
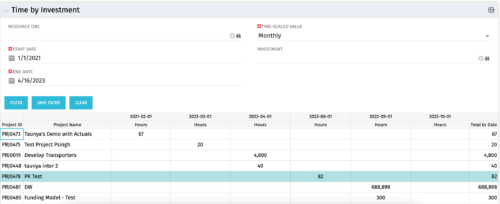
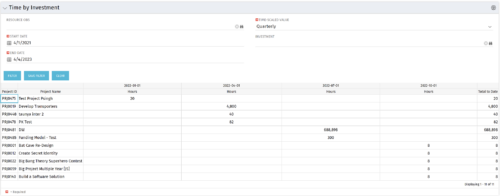 The Time by Investment portlet displays time logged to investments for all investments the logged in user has security rights to view using data from timeslices. It is capable of displaying the data by annual, quarterly, monthly, weekly, and daily segments with totals per date also being presented. The portlet may can be filtered by investment, resource OBS, and time segments. This portlet can be used as a management and governance tool to review aggregate hours posted to investments by time period.
 -
The Time by Investment portlet displays time logged to investments for all investments the logged in user has security rights to view using data from timeslices. It is capable of displaying the data by annual, quarterly, monthly, weekly, and daily segments with totals per date also being presented. The portlet may can be filtered by investment, resource OBS, and time segments. This portlet can be used as a management and governance tool to review aggregate hours posted to investments by time period.
-
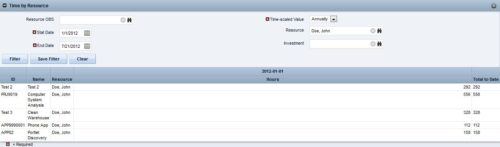
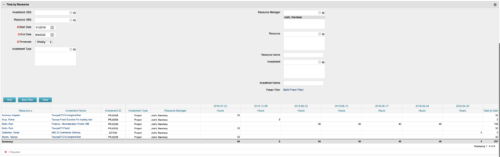 This portlet displays the actual hours resources entered against investments. The per-period actual hours can be showed in days, weeks, months, quarters, or years. The data can be filtered by Resource, Resource Manager, OBS Unit, Investment and time period
 -
This portlet displays the actual hours resources entered against investments. The per-period actual hours can be showed in days, weeks, months, quarters, or years. The data can be filtered by Resource, Resource Manager, OBS Unit, Investment and time period
-
This portlet displays the actual hours resources entered against investments. The per-period actual hours can be showed in days, weeks, months, quarters, or years. The data can be filtered by Resource, Resource Manager, OBS Unit, Investment and time period
-
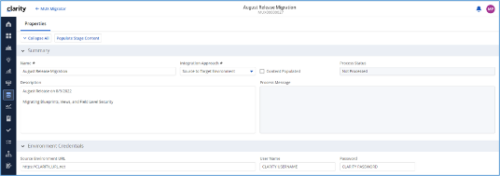
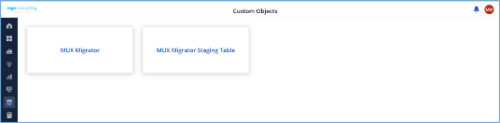
*Note: MUX Migrator v2.0 will only work on Clarity versions 16.1.0 and higher. The Migration Tool for Modern UX Components provides the ability to migrate Blueprints, Views, and Field Level Security between environments. Previously, the promotion of these components needed to be done manually. This functionality, to be utilized by an administrator, is available under the Custom Objects Area of Clarity. Source to Target Approach The user would first create an ‘MUX Migrator’ instance and populate the associated details. Once ready, they will use the “Populate Stage Content” action which will run a workflow in the background to populate a Staging Table with Source Environments content. (Blueprints, Views, and Field Level Security)Installation files are not provided with the download. While the MUX Migration Tool is free, it does require some time by Rego Technical Staff to install. Approximately 4 hours is required. If you are current Rego Customer, this time can be applied against a current project if you choose, or against an Ad Hoc SOW/PO you have in place with us. Please reach out to your friendly Rego Account Director to arrange to have the tool installed. Installation files are not provided with this download. They will be installed by our staff. If you are currently not a Rego client, we invite you to reach out to us at info@regoconsulting.com and we can arrange to set up an Ad Hoc bucket of hours for this install and any future work we can do for you. After a successful populate, they would navigate to the “MUX Configuration” module where they can decide on what content they want to migrate between environments. They can select one to many components they wish to migrate. Once the “MUX Configuration” sub-object is populated, the user can navigate back to the “Properties” module. Once a password is populated, the user can use the Actions drop-down to run the “Migrate Content to Environment” workflow. This will run a process that will migrate the content from the source environment to the target environment. JSON Approach The user would first create an ‘MUX Migrator’ instance and populate the associated details. They would navigate to the “MUX Configuration” module where they can decide on what content they want to migrate between environments. They can select one to many components they wish to migrate. Once the “MUX Configuration” sub-object is populated, the user can navigate back to the “Properties” module. The user can use the Actions drop-down to run the “Export JSON” workflow. This will run a process that will generate a .txt file located in the “JSON File” attribute. That file can be downloaded from the Source Environment. The user can then login to the Target Environment. The user would first create an ‘MUX Migrator’ instance and populate the associated details. Once the ‘MUX Migrator’ instance is created, they can upload the JSON File that was downloaded from the Source Environment. The user can use the Actions drop-down to run the “Import JSON” workflow. This will run a process that will generate read the file located in the “JSON File” attribute and load the configuration into the Target Environment. View Administration The user would first create an ‘MUX Migrator’ instance and populate the associated details. They would navigate to the “MUX View Administration” module where they can decide on what views they would like to update the creator of. They can also reset the “default” view displayed when logged in for a resource(s), Security Group(s), or Resource OBS Node(s). Prerequisites - The user will create the migrator instances/run the processes in the Target Environment they wish to migrate content to (E.g., Run this in PROD to migrate the content from a lower environment to PROD)
- Any attributes that are part of the Blueprints, Views, or Field Level Security must exist in the target environment.
- The user that is utilizing the content must have the following security rights associated to their account.
- XOG rights to all the associated objects
- View/edit security rights to the MUX Migrator Object and MUX Migrator Content Object
- oView rights to the MUX Migrator Staging Table Object
- API-Access
- Process Start or Process AutoStart – All
-
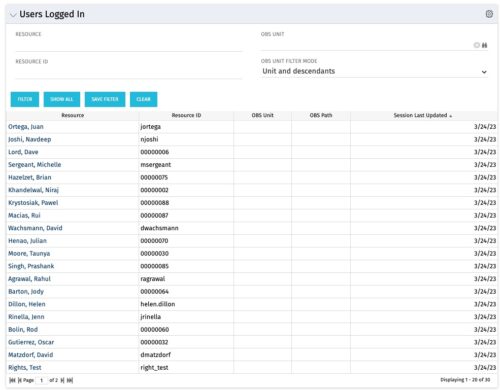 The Users Logged In portlet displays all users logged into the system. This portlet is helpful to determine the capacity during peak times, users still working before downtime, and the ability to view users logged in during the day. The portlet will display the resource, ID, OBS unit, OBS path, and when the user’s session was last updated.
 -
The Users Logged In portlet displays all users logged into the system. This portlet is helpful to determine the capacity during peak times, users still working before downtime, and the ability to view users logged in during the day. The portlet will display the resource, ID, OBS unit, OBS path, and when the user’s session was last updated.
-
 A presentation slide deck from Rego University 2022. Document reviews the 7 trends that Rego is seeing in the PPM space.
- Trend 1: Going Beyond Strategic Alignment
- Trend 2: Pivoting Quickly
- Trend 3: Value Scrutiny for PPM
- Trend 4: Hybrid Financial Management
- Trend 5: AI has the Buzz, Predictive Analytics has the Momentum
- Trend 6: Balanced Ecosystem of Tools
- Trend 7: Collaboration
-
 A presentation slide deck from Rego University 2022. The document reviews the process to follow post tool implementation.
- Typical Post-Implementation / Operational Challenges
- Aspirations for and Outcomes of a High Performing Ownership Team
- Model Solution:
- Roles and Responsibilities
- Intake, Triage, and Delivery Process
- Clarity Board-Based Solution
-
 A presentation slide deck from Rego University 2022. This document reviews the issues around tool adoption and strategies to overcome them.
- The Perception of Adoption
- Top 5 Signs That You May Have Low Adoption
- What is Adoption
- Survey – What is Your State of Adoption
- Keys to Success – What We Have Seen
-
 A presentation slide deck from Rego University 2022. This is a document used to moderate a round table discussion at Rego U.
- What are the Agile Buzz-words and what do they mean?
- Are the Scrum Master and Product Owner roles really full-time?
- Do we need PMs when moving to Agile?
- What’s the role of a Business Analysist in Agile?
- How do you manage a PPM portfolio with Agile teams?
- How do you know when it’s time to “go off-script?”
-
 A presentation slide deck from Rego University 2022. The document reviews creating views and using Apps in Rally. Then digs into creation of Dashboards.
- Refresh on Creating View and Using Apps
- Introduction to Concepts of Dashboards
- Configuring Dashboards & Apps
- Patterns of Useful Dashboards
- Dashboard Patterns
- Examples
- Exercise: Lets create a Dashboard
-
 A presentation slide deck from Rego University 2022. The document covers Doing Agile, Agile Manifesto and then Being Agile.
 -
 A presentation slide deck from Rego University 2022. The course discusses factors that differentiate Requirements.
- Introduction (What & Why)
- Definition & Uses of Requirements
- The Challenges in Requirements in Software
- Revisit the Agile Taxonomy
- The Transition from Traditional to Agile
- Rethink the Agile Portfolio
- Guidelines and Characteristic of Taxonomy
-
 A presentation slide deck from Rego University 2022. This document reviews the principles of Lean Portfolio Management. • What is Lean Portfolio Management (LPM)? • Artifacts of the LPM • Roles of the LPM • Ceremonies of the LPM
 -
 A presentation slide deck from Rego University 2022. This document reviews the principles of Scaled Agile Framework.
- Understanding Agile, Scrum, and Kanban
- The Limits of Team Agile
- Scaling Agile
-
 A presentation slide deck from Rego University 2022. This document reviews the discussion around AI and the more realistic option of Predictive Modeling that exists in the near future of PPM. Then the group worked on ideas to bring to PPM tools via PM.
- Predictive Modeling / AI Trend
- Why are we here? Goals for this session
- Creativity Workshop - Brainstorming
- Summary of Themes
- Qualify top Themes
-
 A presentation slide deck from Rego University 2022. The document reviews the best practices around annual planning for your Clarity instance.
- Introduction
- Annual Planning Basics
- Clarity in Annual Planning
- Investment Tracking
- Resource Planning
- Financial Tracking
- Prioritization
-
 A presentation slide deck from Rego University 2022. This document reviews how Clarity and Apptio can work together.
- Typical Challenges
- Apptio Introduction
- Clarity / Apptio Solution
- Rego’s BETA Integration
-
 A presentation slide deck from Rego University 2022. This document reviews best practices for Demand Management.
- Define Demand for your organization
- Support the Planning business process directly in Clarity
- Think through the process to standardize forms and required data – from capturing the data to leveraging it in views, Roadmaps, Hierarchies and/or reports
- Identify and engage Users and Consumers
- Keep it simple: Understand expected business outcomes when defining required fields, and eliminate everything that isn’t necessary
-

A presentation slide deck from Rego University 2022. This document reviews the best practices for Financial Management in Clarity. - Involve the Finance Team
- Finance will drive financial classifications, resource rates, and capitalization rules
- Keep Things as Simple as Possible
- Streamline financial classifications in both the Estimation and Actuals processes
- Clarity is Not the Company’s Financial System of Record – it is a Project and Portfolio Management System
- Clarity may never match general ledger or project accounting module 100%
- Spend Time on the Full Architecture – Current and Future State
- Start With Required Outputs and Work Backward
- Integrate to Avoid Duplicate Entry
- Involve the Finance Team
-

A presentation slide deck from Rego University 2022. This document reviews the best practices for project management in Clarity. - Typical PM Activities
- Use Clarity: Get Off of Excel
- Make Information Easier to Access
- Make Flags Easy to Identify
- Simplify & Automate Reporting
- Open Discussion #3
- Work with a Regular Cadence
- Sample Schedule
-

A presentation slide deck from Rego University 2022. This document reviews the best practices for resource management in Clarity. - Implementation
- Availability
- Allocation
- Assignment
- Reporting
- Notification
- Data Maintenance


Copyright 2023 • Rego Consulting Corporation • Privacy Policy