-
 This training document is a Rego Consulting Quick Reference Guide to assist with the My Tasks View in Clarity’s Modern User Experience. Guide shows how Tasks are access by use of the Task icon in the menu.
 -
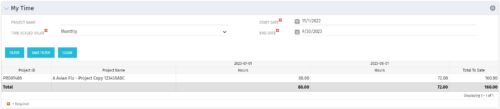 The My Time portlet provides the logged in user with the ability to view his or her time by project by time period without having to go into each period individually on the Timesheets page. This portlet uses the actual timeslices to retrieve data. It displays the amount of time worked per week, month or quarter on projects. The user may specify the dates, time-scaled value and the project name. The portlet also provides a Total to Date, which shows the total number of actuals for that resource on that assignment.
 -
The My Time portlet provides the logged in user with the ability to view his or her time by project by time period without having to go into each period individually on the Timesheets page. This portlet uses the actual timeslices to retrieve data. It displays the amount of time worked per week, month or quarter on projects. The user may specify the dates, time-scaled value and the project name. The portlet also provides a Total to Date, which shows the total number of actuals for that resource on that assignment.
-
 Are you on an older version of CA PPM? Do you want to understand the value of the new features and functions in recent versions? Have you seen the new UX and do you wonder when is the right time to move over? This class is a demonstration of the new UX, new features in both classic and new UX, and the value of these features for customers.
 -
 CA has advertised the addition of RESTful APIs into the core product in version 14.3. What does this mean to you? What does this do to help you support CA PPM? This class will review the new APIs and discuss what they enable for you.
 -
 Clarity’s new reporting capabilities deliver interactive insights directly within the platform—no data exports required. In this session, you’ll learn how to harness the latest reporting features to empower decision-makers, visualize portfolio performance, and tell compelling stories with your data.
 -
 IT is the most common PPM use case, but we are seeing more and more non-IT groups embrace CA PPM. This class will go through the most common PPM use cases outside of IT - Engineering, NPD, PSA, Audit, Marketing, etc.
 -
 Apptio can be used for so much more than App TCO and Service Costing. Let's talk about valuable non-traditional use cases you might want to consider exploring.
 -
 A review of how Northern Trust integrates financial systems with Clarity PPM bilaterally, providing the Finance organization crucial information, and NT Project Managers with a birds-eye view of project financials. Utilizing the Rego Data Extractor and the Rego Data Processor, these information exchanges help Portfolio and Project Managers eliminate their manual and redundant efforts, solidify their overall data accuracy, and dramatically improve the content provided to their Execs for decision-making.
 -
 Course description: “Are you an NPD CA PPM user? This session is dedicated to NPD users to discuss some of the unique requirements and configurations needed to support project management for new product development.” Download file is the slide deck used for the presentation.
 -
 A presentation slide deck from Rego University 2022. The course outline document for the creation of NSQL Portlets for Clarity.
- Multi-Dimensional Portlets
- NSQL Syntax
- Creating a sample portlet
- Limitations
- Common errors and best practices
- Hierarchical Portlets
- NSQL Syntax
- Creating a sample portlet
- Limitations and best practices
- Multi-Dimensional Portlets
-
 A presentation slide deck from Rego University 2022. The course outline for developing NSQL Portlets, Intermediate Level, for Clarity.
- Chart Portlets
- Types / Uses
- Creating a sample portlet
- Limitations
- Drilldown Portlets
- Overview
- Example
- Other Examples and Assets
- Chart Portlets
-
 Nudge is a new tool developed by Rego to capture team sentiment in an anonymous, unobtrusive way, using micro surveys through MS Teams.
 -
 A presentation slide deck from Rego University 2022. Broadcom’s presentation on OKRs in an Agile environment.
- What are OKRs? Why are they important?
- Why ValueOps for OKRs?
- How do we do this?
-
 Course Description: Does your company have Office 365, but you’re not sure what it can do for you? This session will cover what Office 365 is, including insights into how Office 365 can help your teams work faster and smarter.
 -
 Do you want to understand what other organizations are doing to manage ongoing CA PPM enhancements and releases? This class will review some best practices we have seen within our customers to managing a successful backlog of CA PPM work.
 -
 Course Description: Do you struggle with how to implement a perpetual education program that continues to add value within the organization? This session will discuss best practices in the creation and structuring of an ongoing training and mentoring approach to assist with Clarity PPM adoption.
 -
 The Open and Close Periods process closes the earliest open time period and opens the first closed time period after the latest open time period. This process may be used for a non-administrator to open and close time periods without having access to the administrative side. The process is executed through the job Execute Process. For example, our oldest time period is January 6, and our most recent is May 1, it would close out January 6, and open a time period for the week after May 1.
 -
 A Rego training deck that walks through the various aspects of Open Workbench and offers tips and trick on using the tool to manage projects in sync with Clarity. Covers: Opening a plan, Multiple Staffing, Preference Options, Quick Access Toolbar, Quick Search and Quick Filter, Views and Filters, Copying Plans, Work Breakdown Structure, Dependencies, Assignments, Autoschedule, Baselining and Plan Closure.
 -
 Course Description: Have you heard of change management, but you're not quite sure what it is? This introductory class will provide a high-level overview covering the basics of change management as a practice to help your projects reach their goals and obtain benefits realization more quickly.
 -
 Do you want to know more about building outbound integrations using a flat file placed on an SFTP Server? Does your organization have an external BI tool like Cognos, Tableau, Domo, or Qlikview? This session will review strategies for getting data into your corporate BI tools. We will also show Rego's data extraction tool and how it can be used for all outbound file-based integrations to save money and time.
 -
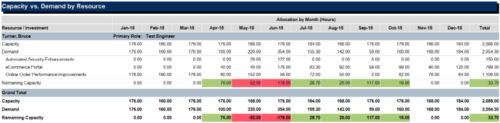
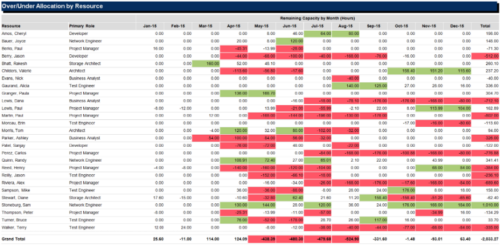
 The Over/Under Allocation by Resource report displays resource remaining capacity amounts by resource. The report displays amounts by week or month. The amounts can be displayed as hours or FTEs. This report allows you to drill down to the Capacity vs. Demand by Resource report, by clicking a resource name, to see more information about the resource capacity and demand. Report Prerequisites Verify that you have completed the following prerequisites before you run this report: • The Load Data Warehouse job must be run before you run this report. If the Data Warehouse is not populated, the report will not display any data. Also, most of the report parameters do not display options.
 -
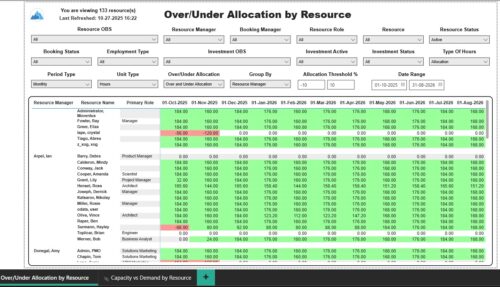
 The Over/Under Allocation by Resource report is a transaction based Jaspersoft report that does not require the Load Jaspersoft Datawarehouse job to be run. The report will pull real-time data from the transaction tables in Clarity. This report can be run from either the Advanced Reporting or Reports and Jobs area within Clarity. The Over/Under Allocation by Resource report displays resource remaining capacity amounts by resource. The report displays amounts by week or month, and in total. The amounts can be displayed as hours or FTEs.
 -
 Looking for more value in Open Workbench? Learn tricks to decrease the time you spend on project management, as well as best practices around plans, baselines, and dependencies.
 -
 This course will take a deeper dive into Clarity portlets. We'll take the next step after configuring object based portlets, and learn how to write an NSQL query to provide data to your portlet. We'll cover different types of portlets, grids, graphs, and multi-dimensional portlets, demonstrate how to surface the portlet on a page, and channel to it from Modern UX. Including HTML portlets and scripting tips.
 -
 The leadership of your organization plays a vital role in the success of your Agile transformation. It is not always known or understood what role and what specific activities and behaviors are needed by leadership. In this session you will gain some guidance on how to appropriately get your senior leaders on board and ensure they are positioned to support the Agile journey in the most effective manner
 -
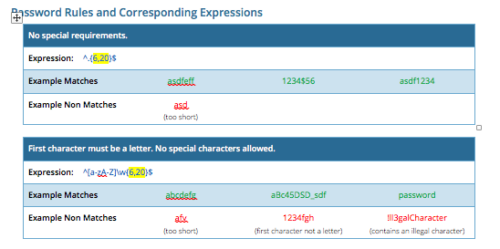 CA PPM allows you to create custom password rules using regex. This document lists expressions for a variety of password rule scenarios. Passwords with length limits default to between 6 and 20 characters. You can change this by editing the highlighted section of the expression. The number before the comma is the minimum password length, and the number after the comma is the maximum password length.
 -
 Course Description: Are your reports and portlets performing well? This class will walk you through specific SQL tuning tricks to make queries run faster, increase end user satisfaction, and smooth-out system performance. This is an easy way to promote efficient future development and make a huge, positive impact on user experience.
 -
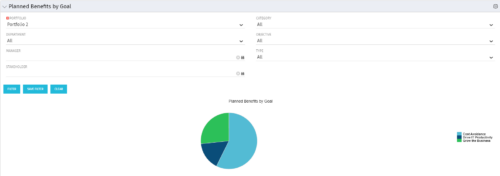 Part of the Business Transformation Package, this pie chart portlet shows planned benefits across the system grouped by Goal. The data is displayed form the investments in a portfolio. The portlet lets the Portfolio Manager know on which GOAL the planned benefit is allocated, so as to target the overall investment spread in the portfolio.
 -
Part of the Business Transformation Package, this pie chart portlet shows planned benefits across the system grouped by Goal. The data is displayed form the investments in a portfolio. The portlet lets the Portfolio Manager know on which GOAL the planned benefit is allocated, so as to target the overall investment spread in the portfolio.
-
 Part of the Business Transformations collection, this portlet displays planned revenue as defined by a project whose goal is "Grow the business". It uses the Planned Revenue Query as a data provider. This portlet provides a holistic overview of how many projects following the goal “Grow the Business” are Critical/ At Risk / On Track with regard to the planned revenue.
 -
Part of the Business Transformations collection, this portlet displays planned revenue as defined by a project whose goal is "Grow the business". It uses the Planned Revenue Query as a data provider. This portlet provides a holistic overview of how many projects following the goal “Grow the Business” are Critical/ At Risk / On Track with regard to the planned revenue.
-
 Part of the Business Transformation collection, this portlet displays count of the planned benefits (savings) per project manager. It also displays if any of the planned benefits are Critical/ At Risk / On Track, along with the total planned benefit amount.


Copyright 2023 • Rego Consulting Corporation • Privacy Policy