-
 Part of the Business Transformation Collection, this bubble-chart portlet displays investments per their alignment, status and total planned benefit. The: X-axis displays the alignment Y-axis displays the status Bubble-size displays the total planned benefit
 -
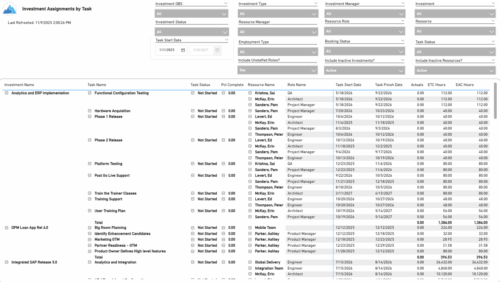 The Investment Assignments by Task report provides a detailed breakdown of effort at the task-assignment level for each investment. It displays both actuals and estimates for resource assignments, along with task status, percent complete, and assignment start and finish dates. Totals are available at the investment level, making it easy to analyze workload, progress, and effort distribution across tasks and resources.
 -
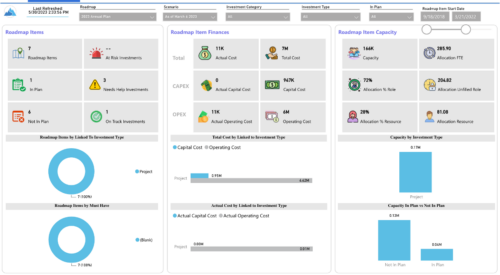
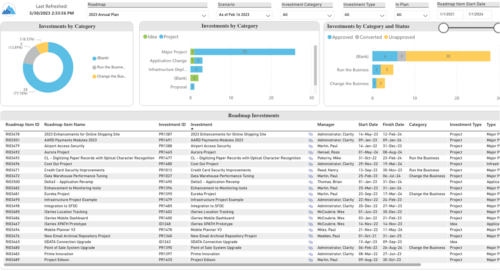 Plan your future work by comparing different scenarios, including in-flight work, and determine the best course of action for your organization. Report Views include: • Roadmap Details • Resource Investment Demand • Roadmap Financials • Roadmap Investment Gantt • Roadmap Item Gantt • Roadmap Overview – Default Scenarios • Roadmap Overview – Single Roadmap Selection • Scenario Comparison Demo Video - https://www.youtube.com/watch?v=RjdvrRd4ZG0&list=PLXJ5ktuWV0jiS9CvBpHvBIwpKPmA9uvwK&index=7
 -
 Plan your future work by comparing different scenarios, including in-flight work, and determine the best course of action for your organization. Report Views include:
- Roadmap Details
- Resource Investment Demand
- Roadmap Financials
- Roadmap Investment Gantt
- Roadmap Item Gantt
- Roadmap Overview – Default Scenarios
- Roadmap Overview – Single Roadmap Selection
- Scenario Comparison
-
 A presentation slide deck from Rego University 2022. A review of the best practices in IT Planning from an Apptio perspective.
- Custom layouts
- Bookmarks
- Dropdown and autofill
- Cost object permissions
- Dashboard reports
- Targets
- Change history / Event Log
- Data input enforcement
- Managing archive
- Stay on top of product updates
-
 Course Description: Do you know what PPM, APM, Agile, ITFM, and other tools are available in the marketplace? Have you taken a strategic look at the key IT processes and tools that exist to support them? Have you been asked to evaluate and recommend a PPM tool? This class will review other ITBM tools and examine their pros and cons. We will also provide six keys to evaluating a PPM solution.
 -
 Course Description: The single biggest risk for CIOs and IT organizations today is not being able to make good spending decisions at the pace of digital business.
- Challenges
- Investment Planning
- IT Financial Management
- Agile Financials
- ServiceNow ITFM Capabilities
- Apptio Introduction
- ServiceNow / Apptio Solution
- Best Practices
- Pitfalls to Avoid
- Apptio Details
-
 Course description: “How does my financial forecast and budget (project/program/portfolio) relate to the department/cost center budgets that finance prepares? Is there a better way to link the two together? This is a topic many organizations struggle with, and this session will review tools and processes that can help solve this problem.”
 -
 Most organizations use CA PPM as part of an annual planning process, in conjunction with an ITFM or financial system. There is often a struggle to know where CA PPM fits into the process and how to effectively connect the data and processes between these tools. In this class, we will discuss how a PPM tool and an ITFM tool fit together to support annual planning.
 -
 A presentation slide deck from Rego University 2022. An introduction to the use of Jaspersoft Ad Hoc for reporting in Clarity.
- Introduction
- Configuration Basics
- Security Basics
- Installing Jaspersoft Studio
- Interface Introduction
- Data Adapter Setup
- Server Connection Setup
-
 Learn how to take advantage of the ad-hoc reporting capabilities of Jaspersoft, which comes embedded in Clarity 14.2 and later. This class is designed to provide hands on exercises to teach individuals how to utilize the power of this new product. As users begin building their own reports and dashboards, the burden on developers will decrease and Clarity perception and adoption will increase.
 -
 Course Description: Do you already have a basic understanding of Jaspersoft Studio development? This session will include advanced topics like duplicating and modifying an OOTB report, multiple datasets, subreports, charting, widgets integration, and crosstabs. The detailed agenda is as follows: Jaspersoft Advanced – Out-of-the-Box Customization (2 hours) • Discover how to use OOTB reports, OOTB domains, resource bundles, and security access grant schemas. Jaspersoft Advanced – Chart Development (2 hours) • Explore multiple advanced charting techniques and types using built-in charting components, including properties (colors, plot options, sizing, gauges, etc.), dual pie chart, time series, and heat map. Jaspersoft Advanced – Scriptlets (2 hours) • Understand the basics of Jaspersoft Studio scriptlet development, utilizing Java libraries in custom Java classes to perform complex tasks in a simple manner. Jaspersoft Advanced – Roundtable (1 hour) • Understand crystal capabilities missing in Jaspersoft Studio, including sharing examples, report bursting needs, automation needs, and working with internal BI groups.
 -
 A presentation slide deck from Rego University 2021. This course covered configuration basics, security basics, installing JS Studio, Interface introduction, data adapter setup, server connection setup.
 -
 A presentation slide deck from Rego University 2022. An introduction to Jaspersoft Studio for reporting in Clarity.
- Introduction
- Configuration Basics
- Security Basics
- Installing Jaspersoft Studio
- Interface Introduction
- Data Adapter Setup
- Server Connection Setup
-

Learn the basics of creating Jaspersoft studio reports. This session will walk through basic features and introduce report development utilizing the basic report capabilities of Jaspersoft Studio such as Text Fields, Frames, Static Text, Breaks, Lines and Common Page Information Components, Grouping/Sorting, Status Indicators, Dynamic Images, Input Controls, and Basic Charting.
-
 You can now directly query your CA PPM SaaS database without the need for VPN. Utilize the open source SQL client SQuirreL to write read-only queries (up to 1000 rows) against the database.
 -
 An updated version of our training material for Jaspersoft Ad-Hoc Reporting for Clarity. Introduces Jaspersoft as a reporting tool, explains security, the data warehouse, and JS Domains. Then delves into navigation, running a report, creating an ad-hoc report, saving it, creating a cross tab report, creating a chart, creating a dashboard, and scheduling the report.
 -
 A Quick Reference Guide to assist in the process of creating a chart in Jaspersoft. The guide walks through the steps using screenshots.
 -
 A Quick Reference Guide to assist in the process of creating a crosstab in a Jaspersoft Ad-hoc report. The document uses screenshots to walk you through the process.
 -
 A Quick Reference Guide with tips on creating a Dashboard in Jaspersoft. The document walks through the steps and uses screenshots to show the process.
 -
 A Quick Reference Guide to assist in the process of creating a table in a Jaspersoft Ad-Hoc Report. Uses screenshots to walk you through the process.
 -
 A Quick Reference Guide to assist in creating or adding Calculated Fields or Measures to a Jaspersoft Report. Calculated Fields or Measures can be created and added to a new or existing Ad-Hoc view by applying formulas to the measures.
 -
 A Quick Reference Guide to assist in the process of adding filtering for the data to be presented in a Jaspersoft Report. If a report output contains more information than desired, Jaspersoft Reporting provides an interactive filtering capability so only the necessary data is displayed. The filtering conditions can include fields, numbers, dates and text. Filters can be added to reports as they are being created or adding to saved views. Filters cannot be added to a Report.
 -
 A Quick Reference Guide to assist in the process of running a Jaspersoft Report. Guide walks through the steps and has screen shots to assist in the process.
 -
 A Quick Reference Guide to assist in the process of scheduling a Jaspersoft Report to run. Gives you the steps and shows screen shots to assist with the process.
 -
 A presentation by the Broadcom leadership on the meaning of ValueOps and the future of Clarity and Rally.
 -
 Course Description: This unique session is divided into presentation and open discussion segments, where we will focus on offering philosophies and practical tips to increase the wisdom we have about ourselves as we navigate our corporate lives. Using conscious leadership principles as a guide, we will cover topics such as empathy in the workplace, understanding and working through internal drama, and the benefits of meditation and silence.
 -
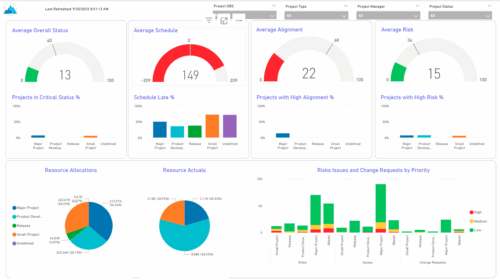 The KPIs by Project Type (Dashboard) report provides visibility into key project health measures, including status, schedule, alignment, and risk. Gauge visuals highlight each KPI at a summary level, while column charts break down results by project type. Resource allocation and actual hours are summarized in pie charts, making it easy to compare utilization across project types. In addition, bar charts display the number of issues, risks, and change requests by project type and priority, helping teams quickly identify areas of concern.
 -
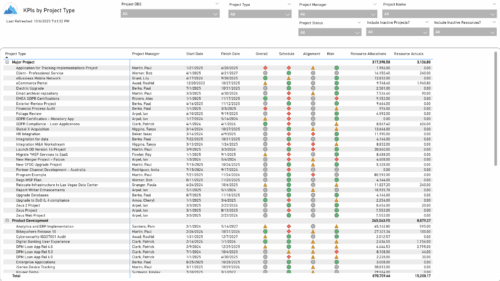 The KPIs by Project Type report provides a consolidated view of key performance indicators across projects, grouped by project type. It highlights metrics such as overall status, schedule, alignment, and risk, along with resource allocation and actual hours tracked since each project’s inception. This report enables quick comparison of performance trends and resource utilization across different project types.
 -
 Course Description: Are you using an older version of Clarity PPM? Do you want to understand the value of new features and functions in recent versions? This class is a demonstration of the new features and the value of these features for customers.
 -
 Do you want to understand the value of the new functionality in Clarity's most recent rollout? This class is for you! Attend an interactive demonstration and put these capabilities in action today.
 -
 Are you on an older version of Clarity? Do you want to understand the value of the new features and functions in recent versions? This class is a demonstration of the new features and the value of these features for customers.
 -
 A presentation slide deck from Rego University 2022. This document reviews the changes to Clarity with the release of version 16.0.3.
- Roadmap Enhancements
- Checklists and To-Dos
- Project and CIT List Enhancements
- Sub-Object Enhancements
- Customer Requests
-
 Are you on an older version of Clarity? Do you want to understand the value of the new features and functions in recent versions? This class is a demonstration of the new features and the value of these features for customers.
 -
 A presentation slide deck from Rego University 2022. This document reviews the importance and principles of Organizational Change Management.
- Why is Organizational Change Management Important?
- Impacts of not recognizing the need for an Organization Readiness (OR) Plan
- What are the components of Organizational Change Management?
- Considerations and activities for building a good OR Plan
- How to execute Organizational Change Management
- Framework – Proven Methodologies and Tools
- Q&A
-
 Lean Portfolio Management (LPM) is one of the most researched and in demand topics for modern enterprises. Come learn what LPM is, key LPM practices and roles needed for success, and how Clarity and Rally provide end to end visibility from strategy to execution.


Copyright 2023 • Rego Consulting Corporation • Privacy Policy