-
 “Resources with No Basic Matrix Entry” portlet displays combinations of project and resource where the assigned resource does or does not have a rate established for that project. Portlet is filterable by Projects, Project ID, Resources, and Missing Rate (Yes, No, All). How does this work? The Rate Matrix Extraction job populates a record into the NBI_PROJ_RES_RATES_AND_COSTS table for every resource/project combination that meets any of the rate matrix criteria. This portlet checks that table, and sets the Missing Rate attribu
 -
“Resources with No Basic Matrix Entry” portlet displays combinations of project and resource where the assigned resource does or does not have a rate established for that project. Portlet is filterable by Projects, Project ID, Resources, and Missing Rate (Yes, No, All). How does this work? The Rate Matrix Extraction job populates a record into the NBI_PROJ_RES_RATES_AND_COSTS table for every resource/project combination that meets any of the rate matrix criteria. This portlet checks that table, and sets the Missing Rate attribu
-
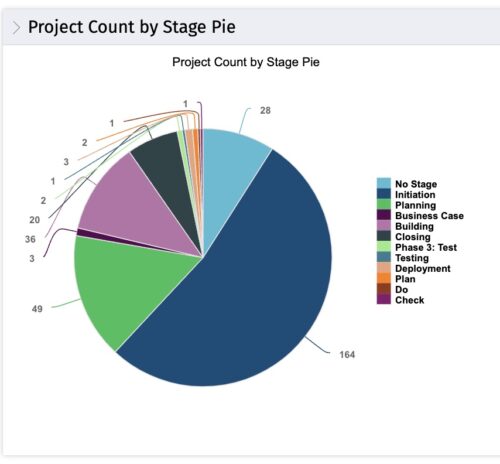 This portlet displays the projects by Stage in a pie chart. Every piece of the pie chart represents a stage of the Project Management methodology applied. The portlet also shows the number of projects on each stage. The legend displays all the different project stages appearing on the portlet. This portlet can be filtered to show only projects from a particular OBS unit or for a particular Project Manager.
 -
This portlet displays the projects by Stage in a pie chart. Every piece of the pie chart represents a stage of the Project Management methodology applied. The portlet also shows the number of projects on each stage. The legend displays all the different project stages appearing on the portlet. This portlet can be filtered to show only projects from a particular OBS unit or for a particular Project Manager.
-
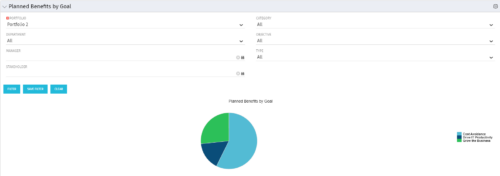 Part of the Business Transformation Package, this pie chart portlet shows planned benefits across the system grouped by Goal. The data is displayed form the investments in a portfolio. The portlet lets the Portfolio Manager know on which GOAL the planned benefit is allocated, so as to target the overall investment spread in the portfolio.
 -
Part of the Business Transformation Package, this pie chart portlet shows planned benefits across the system grouped by Goal. The data is displayed form the investments in a portfolio. The portlet lets the Portfolio Manager know on which GOAL the planned benefit is allocated, so as to target the overall investment spread in the portfolio.
-
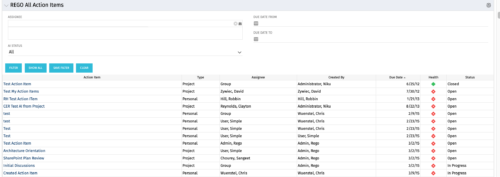 The All Action Items portlet provides detail on all actions items, including the name, type, assignee, status, due date, health indicator and creator of the action item. The portlet can be filtered by project, assignee, AI status, and due date range.
 -
The All Action Items portlet provides detail on all actions items, including the name, type, assignee, status, due date, health indicator and creator of the action item. The portlet can be filtered by project, assignee, AI status, and due date range.
-
 Funnel Chart displays aggregated counts of Ideas by “Idea Progress”, a custom attribute. Chart shows Idea Progress names in legend, and count total is available as a mouse-over. No filters available on this portlet.
 -
Funnel Chart displays aggregated counts of Ideas by “Idea Progress”, a custom attribute. Chart shows Idea Progress names in legend, and count total is available as a mouse-over. No filters available on this portlet.
-
Funnel Chart displays aggregated counts of Ideas by “Idea Progress”, a custom attribute. Chart shows Idea Progress names in legend, and count total is available as a mouse-over. No filters available on this portlet.
-
 Part of the Business Transformation collection, this bar-chart portlet displays number of investments per stage. This provides a holistic overview of where the projects are within the organization.
 -
Part of the Business Transformation collection, this bar-chart portlet displays number of investments per stage. This provides a holistic overview of where the projects are within the organization.
-
Part of the Business Transformation collection, this bar-chart portlet displays number of investments per stage. This provides a holistic overview of where the projects are within the organization.
-
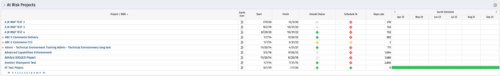 Part of the Business Transformation collection, this bar-chart portlet displays investments and (if exists) any child investments, which are at risk with regard to the schedule of the investments.
 -
Part of the Business Transformation collection, this bar-chart portlet displays investments and (if exists) any child investments, which are at risk with regard to the schedule of the investments.
-
 Pie Chart Portlet displays counts of active projects with various Stale ratings. Calculation is Percent Stale Tasks = number of open (not completed) tasks with a finish date over 15 days old, divided by total open tasks. Filterable by OBS structure and project manager. Data label = project count. Mouse-over and Legend labels = stale rating. More than 90% Stale means 90 to 100% of open tasks on a project have finish dates older than 15 days. More than 71% Stale means 71 to 89% of open tasks on a project have finish dates older than 15 days. 0 - 70% Stale means fewer than 70% of open tasks on a project have finish dates older than 15 days.
 -
Pie Chart Portlet displays counts of active projects with various Stale ratings. Calculation is Percent Stale Tasks = number of open (not completed) tasks with a finish date over 15 days old, divided by total open tasks. Filterable by OBS structure and project manager. Data label = project count. Mouse-over and Legend labels = stale rating. More than 90% Stale means 90 to 100% of open tasks on a project have finish dates older than 15 days. More than 71% Stale means 71 to 89% of open tasks on a project have finish dates older than 15 days. 0 - 70% Stale means fewer than 70% of open tasks on a project have finish dates older than 15 days.
-
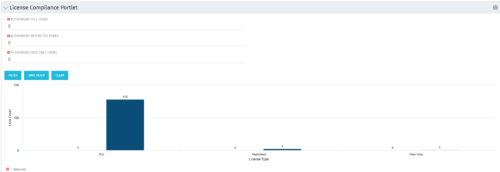 Portlet to quickly show License Compliance for all license types. Simply Enter your License Limits in the filter – The portlet will display the three license types in a grid format with compliance chart and RYG Icons.
 -
Portlet to quickly show License Compliance for all license types. Simply Enter your License Limits in the filter – The portlet will display the three license types in a grid format with compliance chart and RYG Icons.


Copyright 2023 • Rego Consulting Corporation • Privacy Policy