-
 Learn about the various techniques and emerging methods companies are taking to capitalize Agile work. You'll learn how some companies are moving away from timesheets and using models based on story points and team rates to generate capitalization reporting.
 -
 Are you struggling with implementing Agile tools in your organization in addition to Clarity? This class will review best practices for implementing agile tools in conjunction with Clarity - living in a Bi-Modal world. We will discuss how Clarity can be used to govern both types of work and teams and how Agile tools should interface into Clarity.
 -
 Agile metrics can be very different from traditional waterfall metrics. This session will walk through some of the key Agile metrics describing how and why they are used. Effective methods in reporting and sharing will also be covered.
 -
 Would you like to get an overview of the fundamentals of Agile? This session will dispel the misconceptions of Agile and provide an understanding and definition of terms such as “bi-modal”, “Scrum”, “Kanban”, “weighted shortest job first” and “SAFe”. We will also talk about how Clarity fits into the Agile discussion and provide thoughts and practices on how PMOs are responding to this trending methodology.
 -
 Agile is here to stay, but waterfall may be as well. Companies around the world struggle with living in a bimodal development world, while trying to go through an agile transformation. This session will discuss best practices and lessons learned within companies that have gone through agile transformations. We will also review SAFe as a potential approach.
 -
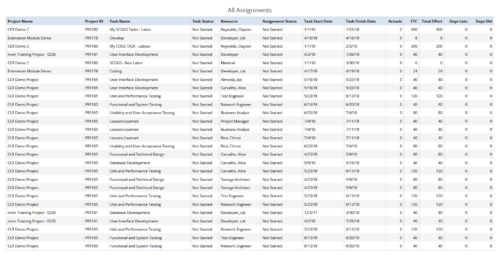 All Assignments report provides the Managers a single place to view all the assignments associated with a project(s). User can view only the investments that he has access to. This report also displays ETC, Actuals, Total Effort, Days Old (Elapsed days between Task Finish Date and Today's Date), Days Late (Elapsed days between Task Finish date and Task Baseline Finish date) associated with the task. You can further narrow your search by OBS Type & Path, Resource Name , Project Manager, Project Name, Project ID, Is project Active?, Assignment Start Date, Assignment Finish Date, Assignment Status and Task Status.
 -
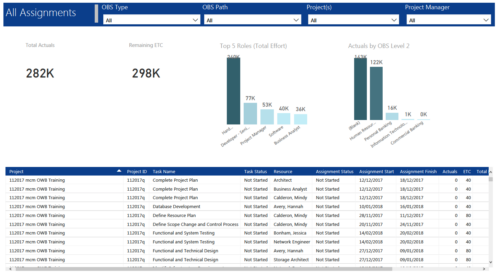 All Assignments report provides project managers a single place to view KPIs related to Task Assignments. All the KPIs are depicted in various visualizations. Total Actuals: Scorecard that displays the sum of actuals associated with assignments for the selected criteria. Remaining ETC: Scorecard that displays the sum of current ETC associated with assignments for the selected criteria. Top 5 Roles (Total Effort): Column chart that displays Effort (Actuals + ETC) by Roles. X axis displays various Roles. Data labels indicate sum of effort associated with that Role. Actuals by OBS level 2: Column chart that displays Actuals by OBS level 2. X axis displays various OBS level 2. Data labels indicate sum of actuals associated with that OBS. Grid: Displays Assignment details such as Project ID, Project Name, Task Name, Task Status, Assigned Resource, Assignment Status, Assignment Start, Assignment Finish, Actuals, ETC, Total Effort, Days Late and Days Old. You can further narrow your search by OBS Type, OBS Path, Project(s) and Project Manager.
 -
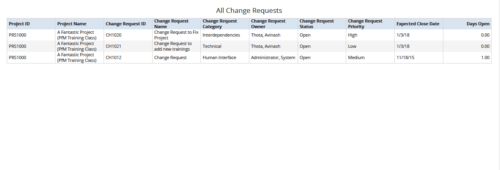 All Change Requests report provides the project manager a single place to view change requests across multiple projects. This report displays Project Information such as ID & Name, Change Request Information such as its ID, Name, Category, Owner, Status, Priority, Expected Close Date and Days Open. You can further narrow your search by OBS Type & Path, Change Request Status, Change Request Name, Change Request Category, Change Request Owner, Project Name and Project Manager.
 -
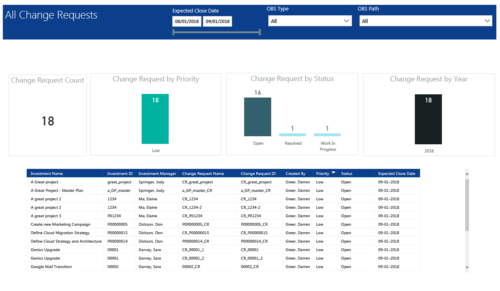 All Change Requests report provides project managers a single place to view KPIs related to Change Requests. All the KPIs are depicted in various visualizations. Change Request Count: Scorecard that displays the # of Change Requests for the selected criteria. Change Request by Priority: Column chart that displays # of Change Request by Priority. X axis displays various Change Request priority. Data labels indicate the number of Change Request associated with that category. Change Request Status: Column chart that displays # of Change Request by Status. X axis displays various Status. Data labels indicate the number of Change Request associated with that Status. Grid: Displays Change Request details such as Investment ID, Investment Name, Investment Manager, Change Request ID, Change Request Name, Status, Priority and Expected Close Date. You can further narrow your search by Expected Close Date Range, OBS Type and OBS Path.
 -
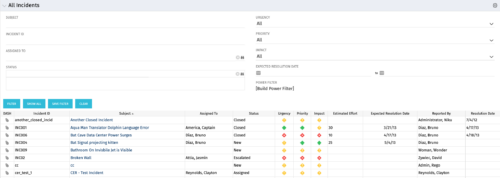 The All Incidents portlet shows all Incidents the user has view rights on and provides a single view to increase ease of management. Status indicators provide a quick overview of incident statuses so a user may prioritize. The filter then allows the user to narrow their search using date ranges and/or resources assigned. Other alternatives for filtering include the status, urgency, priority or impact of the Incident.
 -
The All Incidents portlet shows all Incidents the user has view rights on and provides a single view to increase ease of management. Status indicators provide a quick overview of incident statuses so a user may prioritize. The filter then allows the user to narrow their search using date ranges and/or resources assigned. Other alternatives for filtering include the status, urgency, priority or impact of the Incident.
-
The All Incidents portlet shows all Incidents the user has view rights on and provides a single view to increase ease of management. Status indicators provide a quick overview of incident statuses so a user may prioritize. The filter then allows the user to narrow their search using date ranges and/or resources assigned. Other alternatives for filtering include the status, urgency, priority or impact of the Incident.


Copyright 2023 • Rego Consulting Corporation • Privacy Policy