-
 This training document is a Rego Consulting Quick Reference Guide to assist in the replacement of roles with named resources in Clarity’s Modern User Experience. This doc references version 16.3 views. Document provides detail on soft bookings, default allocation and requested manager. Instructions are provided on how to access requests from the Staffing Plan view and how to swap the role for a named resource. If requests are not fulfilled in their entirety, details are provided on how the excess allocation is handled.
 -
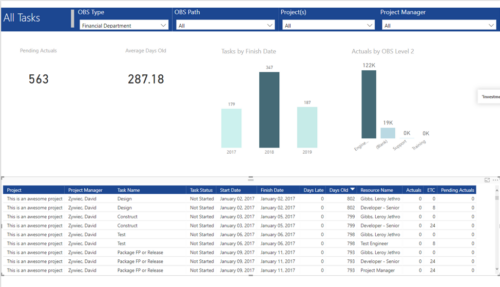 All Tasks report provides project managers a single place to view KPIs related to Tasks. All the KPIs are depicted in various visualizations. Pending Actuals: Scorecard that displays the # of Actuals that are still open and not yet posted. Average Days Old: Scorecard that displays the average number of Task Days Old. Days Old is the difference between Task Finish date and Today’s Date (when Today’s Date > Task Finish date. In other cases, it is zero) Tasks by Finish Date: Column chart that displays # of Tasks by Year of Finish date. X axis display Calendar years. Data labels indicate the number of Tasks finish date within that year. Actuals by OBS level 2: Column chart that displays sum of Task Actuals by OBS level 2. X axis display OBS level2. Data labels indicate the Actuals within that OBS level2. Grid: Displays Risk details such as Project Name, Project Manager, Task Name, Task Status, Start Date, Finish Date, Days Late, Days Old, Actuals, ETC and Pending Actuals Days Late is the difference between Task Finish date and Baseline Finish Date (when Baseline Finish Date > Task Finish date. In other cases, it is zero) You can further narrow your search by OBS Type, OBS Path, Project(s) and Project Manager.
 -
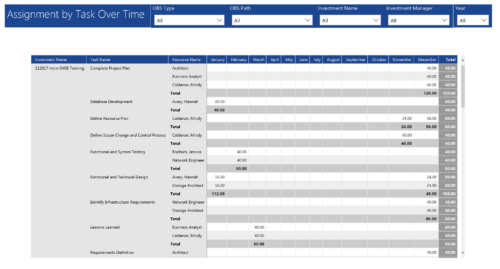 Assignments by Task Over Time report display all assignments by task for all resources. Information is displayed on monthly basis. This report displays Investment Name, Task Name, Resource Name and its monthly assignments. You can further narrow your search by OBS Type & Path, Investment Manager, Investment Name, and Year
 -
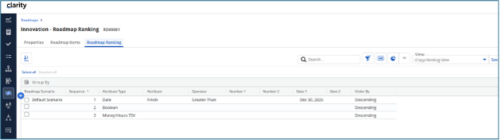
 The Rego Roadmap Ranking provides the ability to rank Roadmap Items within individual Roadmap Scenarios. The function allows the user to define a hierarchical sequence to defined attributes to create a set of rules to generate an auto-ranking, by scenario. Large sets of ranking rules increase complexity and variability, so choose initial rules carefully. When the rank order is configured, a process is actioned that auto-ranks the Roadmap Items for the selected Roadmap Scenario. The Roadmap Ranking can be viewed through the Timeline, Board, or Grid View.
 -
 Project Manager- Resource/Compliance report provides project managers a single place to view Compliance status for various critical KPIs. All the KPIs are depicted in various visualizations.
- Unfilled Demand: Donut chart that gives you the count of roles (within projects) that are not filled by resources.
- # Of New team members: Scorecard that displays the count of new team members added to the projects.
- Resource Constraints: Donut chart that gives you the count of Over utilized and underutilized resources
- Unsubmitted Time: Dial gauge that displays the count of resources that did not submit time.
- Stale Tasks: Dial gauge that displays the count of tasks that are past their due date
- Status Report Compliance: Dial gauge that displays the compliance of status reports for various projects.
-
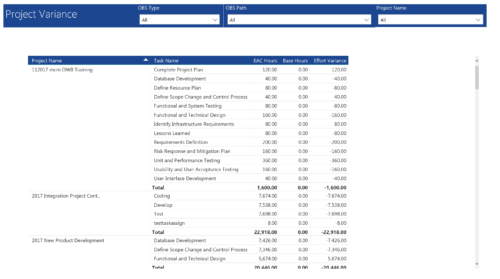 Project Variance report provides project managers a single place to view all their active projects, open tasks, Task EAC hours, Task Baseline hours and their variance. Project Managers can use this report to view and manage their projects progress against their baselines. They can easily detect the projects that are running behind and pinpoint the tasks that are causing the variance in the schedule. You can further narrow your search by OBS Type, OBS Path and Project.
 -
This training document is a Rego Consulting Quick Reference Guide to assist with Allocations Timeline in Clarity’s Modern User Experience. This doc reviews the Investment Timeline and the Resource Histogram sections of the Allocations Timeline.
-
 This asset in used to update investment level TSV attributes using Cost Plan, Budget plan, Actual transaction, Planned and Budgeted Benefit Cost data as needed. It uses mappings/logic from ‘Cost Rollup Mappings’ object. Compatibility – Its compatible from 16.0 onwards with Oracle, PostgreSQL and MSSQL.
 -
 This training document is a Rego Consulting Quick Reference Guide to assist with the Resources Workspace in Clarity’s Modern User Experience. This doc references version 16.3 views. Document reviews the Resources, Roles and Teams tabs in the Resources Workspace.
 -
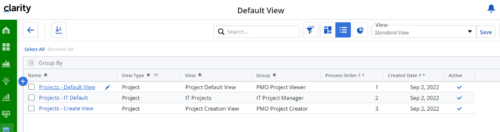
Manage default views for new users based on security groups or publish a view to all users in a specified security group. For more details, please refer to the detailed documentation.
-
 The Financial Summary by Transaction Class provides a visual graph for each year’s financial picture for multiple years. Report contains the following items: KPIs: Displays total benefit, capital, expense and net cash flow for the selected filter criteria Grid: Displays year wise break up of benefit, capital, expense and net cash flow for the selected filter criteria Graph: Benefit, capital, expense and net cash flow are depicted in graphical way for multiple years. This report will show the user where they need to concentrate their efforts in order to meet financial commitments. User can further narrow their search by OBS Type & Path.
 -
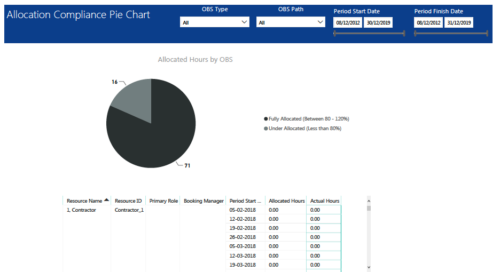 Allocation Compliance Pie Chart report provides resource managers a single place to view Allocation compliance for various resources. It displays the following: Allocated Hours by OBS chart: Pie chart that displays percentage of resources that are fully allocated (80 -120 %) and under allocated (less than 80%) for a particular OBS and selected period range. Grid: Displays Resource Name, Resource Id, Primary Role, Booking Manager, Period, Allocated hours and Actual hours during that period. You can further narrow your search by OBS Type, OBS Path & Period Date range.


Copyright 2023 • Rego Consulting Corporation • Privacy Policy