-
 ** No Download - Do not Add to Cart** - Register for the White Paper at this link - http://info.regoconsulting.com/clarity-roadmaps-fastest-route-to-success Anyone who’s taken a road trip knows the value of a good map. It tells you where you’re going, how long it might take to get there, and where you are at any given time. Your organization’s strategic journey is no different. Whether it’s your corporate strategy or individual investments, you’re heading into territory that could include all kinds of intersections, delays, and detours that could impact your plan. A good roadmap will give you the critical information you need to ensure a smooth journey. In this white paper, we discuss how using Clarity's Roadmap feature will get you pointed in the right direction for success.
 -
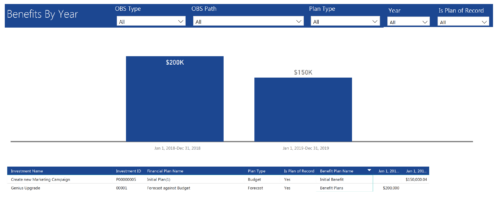 Benefits by year report provide the project manager a single place to view Benefit plan (Forecast /Budgeted) and its associated benefit for various years across multiple projects. Information is displayed in a bar graph and user can further drill down the details to investment level. Project Managers can use this report to analyze if the projects are giving intended benefits and take appropriate decisions accordingly. User can further narrow their search by OBS Type & Path, Plan Type (Budget/Forecast), Year and Is Plan of Record?.
 -
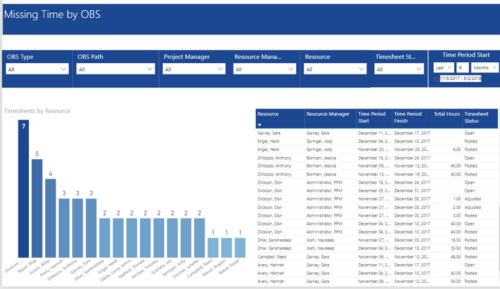 Missing Time by OBS report displays Resource whose timesheets are missed. There is Clustered Column Chart which displays Timesheets count by Resource. Also, there is table view of Resource, Resource Manager, Time Period Start and Finish Dates, Total Hours and Timesheet status. User can narrow their search by OBS Type & Path and Project Manager, Resource Manager, Resource, Timesheet Status and Time Period Start Date (Relative or Specific Date Range).
 -
 This training document is a Rego Consulting Quick Reference Guide to assist in the replacement of roles with named resources in Clarity’s Modern User Experience. This doc references version 16.3 views. Document provides detail on soft bookings, default allocation and requested manager. Instructions are provided on how to access requests from the Staffing Plan view and how to swap the role for a named resource. If requests are not fulfilled in their entirety, details are provided on how the excess allocation is handled.
 -
 This training document is a Rego Consulting Quick Reference Guide to assist with the creation of Status Reports in Clarity’s Modern User Experience. This doc references version 16.3 views. Document covers the creation of Status Reports via the Status Module as well as the Status Report Module. Detail is provided on the widgets that can be used within the Status Report canvas as well as instructions on how to configure the canvas. Detail is also provided on how to Preview and Publish status reports.
 -
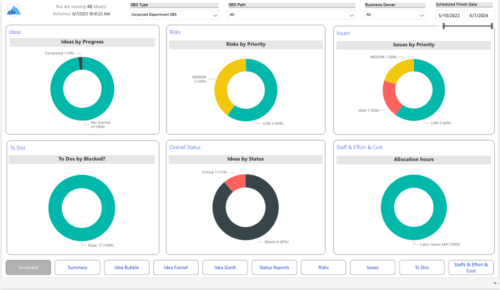 Master your pipeline as you prioritize, visualize, and analyze ideas, assess their feasibility, and track progress from inception to execution. Report Views include: • Idea Bubble • Idea Details • Idea Funnel • Idea Gantt • Idea Overview • Idea Staff and Effort • Idea Status • Idea To Dos Demo Video - https://www.youtube.com/watch?v=xPSxOlrqEq8&list=PLXJ5ktuWV0jiS9CvBpHvBIwpKPmA9uvwK&index=3 The main .rpt file will access data through the Data Warehouse. For clients on Rego’s AWS hosting, we have versions that work with Oracle and Postgres DB and access the live database, if the Rego Odata connector is being used.
 -
 A Quick Reference Guide to assist in the creation of Hierarchies in Clarity’s Modern UX. Clarity PPM provides the ability to create one or more hierarchies that define the relationships between ideas, projects or custom investments. Each hierarchy contains up to a 500 tree card diagram that shows a parent-child relationship between the tree cards.
 -
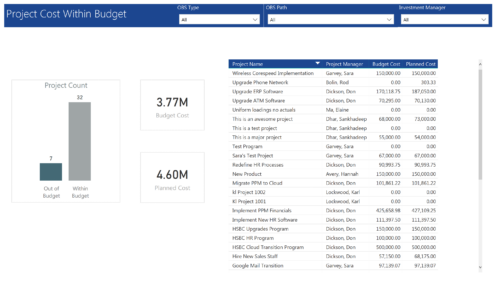 Project Cost within Budget report displays count of projects that are within or exceeding budget in the form of a bar chart. It also displays Total budget cost and Planned cost. User can further drill down the details to investment level. You can further narrow your search by OBS Type & Path and Investment Manager.

