-
 Do you have enough experience with the data model to be dangerous - maybe just the basic project and resource tables? This class will take you to the next level in understanding the Clarity data model and provide training on how to write NSQL queries within Clarity for use in your portlets and reports.
 -
 Do you want to talk to other customers that are using or plan to use demand management? In this moderated Round Table where customers can share experiences and provide insights on process, configurations, challenges, and successes. We will have an expert panel and then divide into small groups and discuss customer selected topics - 100% sharing.
 -
 Has your organization made significant investments in technology solutions without seeing precise results? Do you have the right capabilities yet lack an interconnected, end-to-end solution? Come to this session to learn more about the importance of a living strategic roadmap and how Rego's Digital Ecosystem Assessment program can help. This session will review the key elements needed to create an effective roadmap that can drive increased maturity and excitement within your organization, and how that roadmap can help optimize your digital ecosystem.
 -
 Are you on an older version of Clarity? Do you want to understand the value of the new features and functions in recent versions? This class is a demonstration of the new features and the value of these features for customers.
 -
 Without good data, your digital transformation won’t succeed. This session talks about generating and understanding value stream metrics, including how investments and teams are performing.
 -
 With only 15% of companies successfully transforming digitally, it’s time for the PMO to take charge. This session talks about how the PMO effectively can support the digital transformation within the enterprise by reimagine its traditional charter
 -
 Digital transformation is hard, only 15% of businesses succeed. This course looks at the five biggest customer issues hurting the digital transformation, with a discussion around possible solutions.
 -
 Reporting is typically the only interaction executives, and stakeholders have with Apptio, so reports should be pristine. In this session, we will show you how to improve your Apptio reporting, making it more visually appealing, intuitive, and digestible. We'll give you some tips on how to make your reporting in Apptio pop out like conditional highlighting, leveraging html components, layout and design techniques.
 -
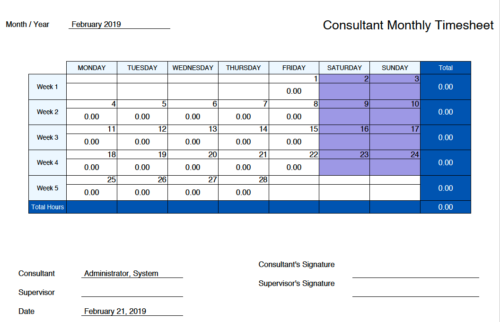 Monthly Actuals -User View is a standard calendar view of actuals posted by logged in user on each day of the selected month. Actuals also includes timesheets that haven’t been submitted/posted yet. Actual hours on the report are tied to user's availability i.e. when user has 0 availability (Saturday/Sunday/Holiday) then actuals are greyed out.
 -
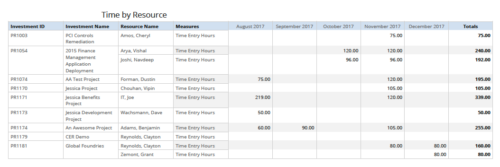 Time by resource is a grid report that provides resource and project managers a single place to view time logged to projects by resource over a period of time. This report provides information such as Investment ID, Investment Name, Resource Name and Time Logged Hours on period basis. Report provides you the flexibility of changing period type to Year, Quarter, Month and Day. You can further narrow your search by OBS Type & Path, Resource Name, Investment Name, Period Start Date and Is Investment Active?
 -
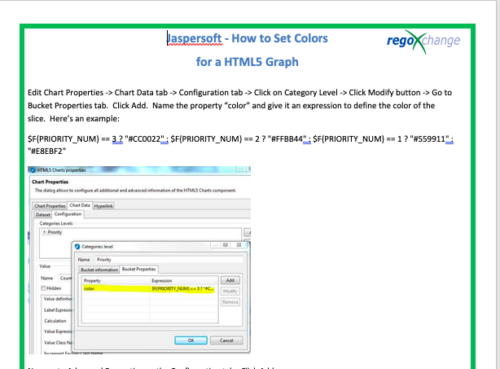 This tech-trick details the steps to set colors for an HTML5 Graph.
 -
 This configuration and accompanying process allows users to capture Financial and Non-Financial (Metrics, Soft, etc.) Benefit in a custom sub-object, then programmatically create an out-of-the-box Benefit Plan with just the Financial Portion from the custom sub-object. The solution is comprised of:
- Sub-Object (Benefit Plan Details, Parent = Project)
- Process: Create Benefit Plan (uses sub-object as primary input, native BP is output)
- Process: Update sql - Cost Benefit Plans (one-time script to update Projects)
- Ensure on the Benefit Details List view the Planned and Realized Amounts are displayed
- Modifying the Create Benefit Plan Process in support of a BP naming convention consistent with local PMO Practices
- Modifying the Create Benefit Plan Process to link the BP to the Cost Plan of Record
- Creating a Portlet that pulls together rows of data from the sub-object across multiple projects in a summarized view as well as a detailed view


Copyright 2023 • Rego Consulting Corporation • Privacy Policy