-
 A Quick Reference Guide to assist in the creation of Hierarchies in Clarity’s Modern UX. Clarity PPM provides the ability to create one or more hierarchies that define the relationships between ideas, projects or custom investments. Each hierarchy contains up to a 500 tree card diagram that shows a parent-child relationship between the tree cards.
 -
 A Rego Training deck that reviews the use of Hierarchies in Clarity PPM’s Modern UX.
- Hierarchies in Clarity PPM can be used to create one or more hierarchies that define relationships between various investments. Each hierarchy includes an investment tress card made up of multiple cards.
- A parent-child relationship between investment cards help stakeholders understand the dynamics of the investments. Stakeholders can use the Hierarchies page to view all the hierarchies in the organization.
- Hierarchies can include different investment types such as; ideas, projects, and custom investments with configurable cards by investment type.
- Hierarchies can display rolled up aggregation metrics.
- Hierarchies can be exported to PDF.
-
 Hierarchies and Roadmaps are two powerful capabilities that Clarity has brought to the market. While they work great independently, have you experimented with how they can work even better together? In this session, come and learn how these two capabilities can complement each other by working in concert giving you both planning and execution insights!
 -
 Hierarchies and Roadmaps are two powerful capabilities that Clarity has brought to the market. While they work great independently, have you experimented with how they can work together, even better? In this session, come and learn how these two capabilities can complement each other by working in concert giving you both planning and execution insights!
 -
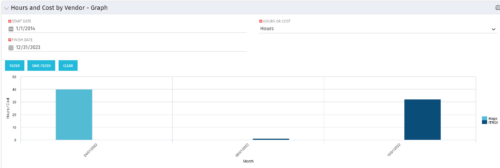 The Hours and Cost by Vendor - Graph portlet displays vendor hour or costs by month. Using this portlet, management is provided with a graphical representation of vendor costs or hours by month for a set of time without running a report or navigating to each resource individually. This portlet uses the monthly actual timeslices. Additionally, the user must select a date range and whether to display hours or costs. Once populated, the graph will display all vendors that currently have hours and cost for the selected date range.
 -
 The Hours and Cost by Vendor - Graph portlet displays vendor hour or costs by month. Using this portlet, management is provided with a graphical representation of vendor costs or hours by month for a set of time without running a report or navigating to each resource individually. This portlet uses the monthly actual timeslices. Additionally, the user must select a date range and whether to display hours or costs. Once populated, the graph will display all vendors that currently have hours and cost for the selected date range.
 -
 The Hours and Cost by Vendor - Graph portlet displays vendor hour or costs by month. Using this portlet, management is provided with a graphical representation of vendor costs or hours by month for a set of time without running a report or navigating to each resource individually. This portlet uses the monthly actual timeslices. Additionally, the user must select a date range and whether to display hours or costs. Once populated, the graph will display all vendors that currently have hours and cost for the selected date range.
 -
 The Hours and Cost by Vendor – Grid portlet displays vendor hour or costs by month grouped by vendor. Using this portlet, management is provided with a quick overview of vendor costs or hours by month for a set of time without running a report or navigating to each resource individually. This portlet uses the monthly actual timeslices. The user may filter by vendor, vendor ID, date, and hours/cost in addition to the start/finish and hours/cost. Once populated, the grid will display all vendors that currently have hours/cost for the selected time frame.

