-
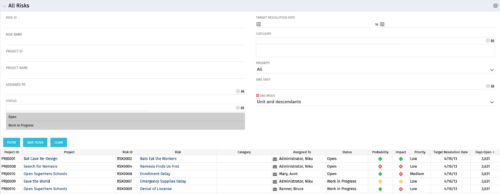 The All Risks portlet displays all risks related to active projects that the logged in user has view rights to access. The portlet provides the project manager a single place to view risks across multiple projects without having to go into each project individually, and allows for more efficient management and reporting across projects. The portlet displays Project ID, Project, Risk ID, Risk, Category, Assigned to, Status, Probability, Impact, Priority, Target Resolution Date, and Days opened. The filter allows narrowing down of the risks by several different criteria. Note: Only the projects that the user has viewer rights to see will show up in the list.
 -
 Tired of repeating the same code in your GEL scripts? Prefer not to write thirty lines just to call a REST web service? Learn tips and tricks for reusing code—like using <include> tags and Rego’s Jam Tags solution to simplify and streamline your scripts. In this session, you'll learn the functionality and advantages to using Jam Tags within your GEL scripts to accomplish tasks that were tedious, error prone, and in some cases impossible within GEL.
 -
 See how multiple Rego innovations can save time, reduce effort, and increase adoption across your organization. Leverage Power Automate to connect Clarity with SharePoint, Teams, and Outlook—automating tasks like creating Teams for projects, managing permissions, and sharing reports with non-Clarity users. Discover how the RegoLink PowerPoint add-in keeps decks up to date with templates and live Clarity data, and how the Excel Data Manager (EDM) simplifies bulk updates by letting you edit and validate data in Excel before syncing back.
 -
 Imagine responding to Clarity PPM workflow tasks (like timesheet approvals, budget reviews, and stage gate decisions) directly from your email. No login required, yet all conversations, decisions, and even context from attachments and images are automatically - and securely - captured in Clarity. Sound like a dream? Join this class to learn how to save time and increase adoption with this easy innovation.
 -
 An engaging, informative session delivered to your organization by a Prosci change management expert. Your leaders, project managers, and others focused on project outcomes will learn how applying change management to projects can increase the likelihood of those projects succeeding. They will also learn about the processes, people and tools needed to align project management and change management.
 -
 Has your organization made significant investments in technology solutions without seeing precise results? Do you have the right capabilities yet lack an interconnected, end-to-end solution? Come to this session to learn more about the importance of a living strategic roadmap and how Rego's Digital Ecosystem Assessment program can help. This session will review the key elements needed to create an effective roadmap that can drive increased maturity and excitement within your organization, and how that roadmap can help optimize your digital ecosystem.
 -
 This class will discuss how other Clarity users solve issues, discover solutions, and successfully use Clarity. As the tool grows in functionality, how should you expect to support the tool and end users. Broadcom's Clarity development team has never been better at getting great capabilities out at a rapid pace, but do you wonder how other organizations, like yours, are keeping up with the enhancements and releases? Come and learn how to drive value for your Clarity investment while not driving your team members crazy with too much change.


