-
 This portlet displays the % allocation of resources to projects. The portlet shows if the resource is allocated to the projects as an individual resource or as part of an Agile team, in which case it will display the resource % allocation to the team and what that will represent in terms of % allocation to the project. The Total Allocation % display the allocation of the resource to all investments is allocated to. Remaining Capacity and Over/Under columns will help identify the resources that still have availability and the ones that are over allocated.
 -
This portlet displays the % allocation of resources to projects. The portlet shows if the resource is allocated to the projects as an individual resource or as part of an Agile team, in which case it will display the resource % allocation to the team and what that will represent in terms of % allocation to the project. The Total Allocation % display the allocation of the resource to all investments is allocated to. Remaining Capacity and Over/Under columns will help identify the resources that still have availability and the ones that are over allocated.
-
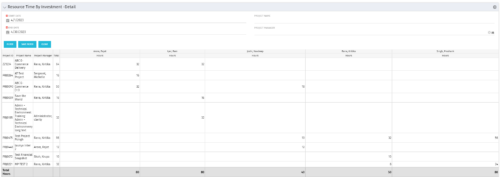 The Resource Time by Investment Detail portlet gives the Resource Manager the ability to search for time reported by resources against investments. The portlet provides filters for specific dates, a particular project and/or Project Manager. Using this portlet, the RM can get an overview of all data in a time period, the overall time logged to a project and the breakdown of his or her resources’ hours on that project.
 -
The Resource Time by Investment Detail portlet gives the Resource Manager the ability to search for time reported by resources against investments. The portlet provides filters for specific dates, a particular project and/or Project Manager. Using this portlet, the RM can get an overview of all data in a time period, the overall time logged to a project and the breakdown of his or her resources’ hours on that project.
-
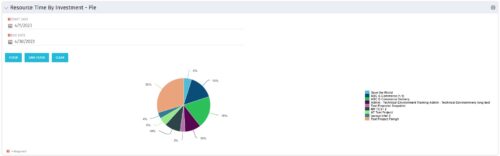 The Resource Time by Investment - Pie portlet shows a graphical representation of the time spent on investments for all resources where the logged in user is selected as the resource manager. The portlet gives the Resource Manager the ability to quickly view all time reported by resources against projects. The portlet filters between specific dates using the daily actuals timeslice. The pie chart provides a graphical view as to how time is divided across projects.
 -
The Resource Time by Investment - Pie portlet shows a graphical representation of the time spent on investments for all resources where the logged in user is selected as the resource manager. The portlet gives the Resource Manager the ability to quickly view all time reported by resources against projects. The portlet filters between specific dates using the daily actuals timeslice. The pie chart provides a graphical view as to how time is divided across projects.
-
 The Resource Time Review by Manager report provides visibility into timesheet entries for each resource, organized by investment manager or resource manager. It details hours entered by day and in total for each investment and time entry, helping managers monitor time allocation and utilization across their teams. This report supports effective oversight of resource effort and project participation.
 -
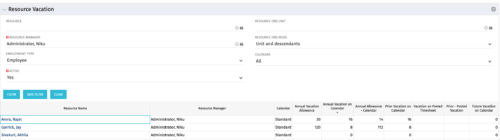 The Resource Vacation portlet allows a resource manager to view a resource’s current annual vacation allowance, as set by the resource manager, against the resource’s vacation calendar hours and actual posted timesheet hours. This portlet is useful for determining the amount of hours a resource has requested off and has remaining. This portlet also ensures the resource has accounted for all annual vacation allowance hours in the calendar and has posted time for all past calendar request hours.
 -
The Resource Vacation portlet allows a resource manager to view a resource’s current annual vacation allowance, as set by the resource manager, against the resource’s vacation calendar hours and actual posted timesheet hours. This portlet is useful for determining the amount of hours a resource has requested off and has remaining. This portlet also ensures the resource has accounted for all annual vacation allowance hours in the calendar and has posted time for all past calendar request hours.
-
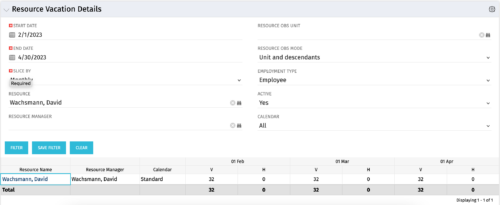 The Resource Vacation Details portlet allows a resource manager, or administrator, to see a resource’s calendar at a glance, displayed by week or month for a selected time period. This portlet shows the Resource Name, Resource Manager, Calendar, H (holiday), and V (vacation) hours for the select time frame.
 -
The Resource Vacation Details portlet allows a resource manager, or administrator, to see a resource’s calendar at a glance, displayed by week or month for a selected time period. This portlet shows the Resource Name, Resource Manager, Calendar, H (holiday), and V (vacation) hours for the select time frame.
-
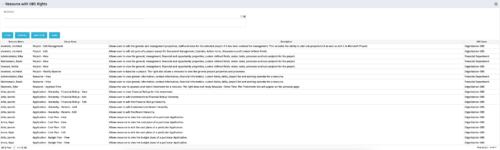 This portlet displays list of resources with OBS rights. This would be helpful for admins to know if a user can perform any actions on object instances of an OBS.
 -
This portlet displays list of resources with OBS rights. This would be helpful for admins to know if a user can perform any actions on object instances of an OBS.
-
This portlet displays list of resources with OBS rights. This would be helpful for admins to know if a user can perform any actions on object instances of an OBS.
-
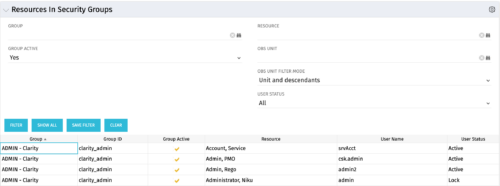 The Resources in Security Groups portlet shows security group information for resources. (Note: the information displayed is dependent on what the user has security rights to view.) The portlet displays the Group, Group ID, if the Group is active, Resource, User Name and User Status. This portlet also includes the ability to filter on a specific group or resource, by whether the group is active, by user status or OBS.
 -
 “Resources with No Basic Matrix Entry” portlet displays combinations of project and resource where the assigned resource does or does not have a rate established for that project. Portlet is filterable by Projects, Project ID, Resources, and Missing Rate (Yes, No, All). How does this work? The Rate Matrix Extraction job populates a record into the NBI_PROJ_RES_RATES_AND_COSTS table for every resource/project combination that meets any of the rate matrix criteria. This portlet checks that table, and sets the Missing Rate attribu
 -
“Resources with No Basic Matrix Entry” portlet displays combinations of project and resource where the assigned resource does or does not have a rate established for that project. Portlet is filterable by Projects, Project ID, Resources, and Missing Rate (Yes, No, All). How does this work? The Rate Matrix Extraction job populates a record into the NBI_PROJ_RES_RATES_AND_COSTS table for every resource/project combination that meets any of the rate matrix criteria. This portlet checks that table, and sets the Missing Rate attribu
-
 This beginner-friendly course will begin exploring project management related themes and how they translate to Clarity. We'll discuss resources and calendars that demonstrate resource availability, and project teams which represent demand against your resources.
 -
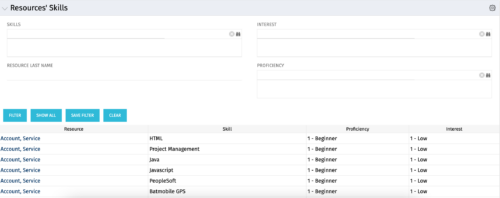 The Resources’ Skills portlet displays all resources, skills, proficiencies, and interests. Using this portlet, resource managers can quickly assess all skills within the system for their resources. The portlet results may be filtered on: Skill, Resource Last Name, Interest and Proficiency.
 -
The Resources’ Skills portlet displays all resources, skills, proficiencies, and interests. Using this portlet, resource managers can quickly assess all skills within the system for their resources. The portlet results may be filtered on: Skill, Resource Last Name, Interest and Proficiency.
-
The Resources’ Skills portlet displays all resources, skills, proficiencies, and interests. Using this portlet, resource managers can quickly assess all skills within the system for their resources. The portlet results may be filtered on: Skill, Resource Last Name, Interest and Proficiency.
-
 Take a deep dive into Clarity's REST APIs. You will learn different ways to explore Clarity's API's using the REST API explorer, Postman, and Chrome's Developer Tools. We will cover HTTP methods, status codes, Clarity-specific headers, and creating and parsing JSON.
 -
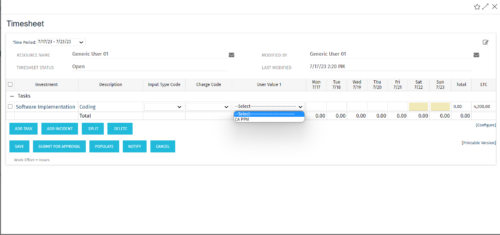 The tech-trick shows how to retrieve logged in User related values (ex: skill set) in timesheet.
 -
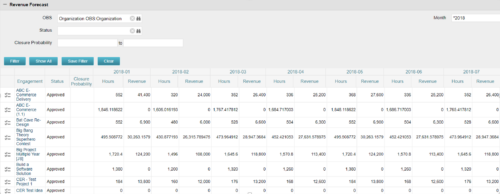
The Revenue Forecast portlet displays projected revenue at a project level broken out by month. This portlet assists in viewing all project revenue data at once and making it easily exportable. The table below describes the available filter fields in the portlet. Column Label Description OBS OBS to filter projects with Status Status of the project Closure Probability ? Months Month(s) of Project Revenue to display -
The Revenue Forecast portlet displays projected revenue at a project level broken out by month. This portlet assists in viewing all project revenue data at once and making it easily exportable. The table below describes the available filter fields in the portlet. Column Label Description OBS OBS to filter projects with Status Status of the project Closure Probability ? Months Month(s) of Project Revenue to display -
The Revenue Forecast portlet displays projected revenue at a project level broken out by month. This portlet assists in viewing all project revenue data at once and making it easily exportable. The table below describes the available filter fields in the portlet. Column Label Description OBS OBS to filter projects with Status Status of the project Closure Probability ? Months Month(s) of Project Revenue to display -
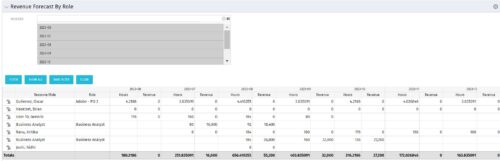 The Revenue Forecast by Role portlet displays forecasted revenue by both resource and role on the given project, broken out by month. The table below describes the available filter fields in the portlet.
Column Label Description Months Fiscal months to display -
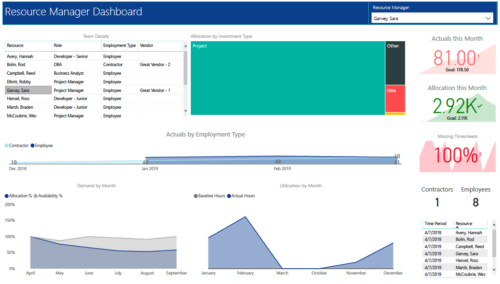 RM Dashboard shows various KPIs like Actuals posted by the resources in last month, Allocation in current month, count of missed timesheets etc. Team Details – Grid report providing list of all the resources managed by a resource manager. Allocation by Investment type – Tree graph displaying distribution pattern of allocation hours across different investment types. Actuals by Employment Type - Area graph, displaying actual hours posted by Employees Vs Contractors. Demand by Month – Area graph, displaying Allocation Vs Availability for next 6 months. Utilization by Month - Area graph, displaying Baseline Vs Actuals hours over last 6 months.
 -
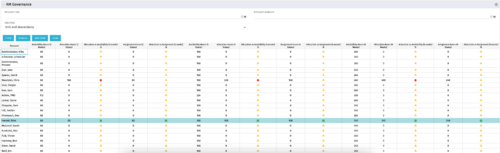 The RM Governance portlet provides resource availability, allocation, and comparison of the two values at 2, 4, and 8-week intervals. Allows searching on any RM or resource OBS instead of pre-filtering for the logged in user.
 -
The RM Governance portlet provides resource availability, allocation, and comparison of the two values at 2, 4, and 8-week intervals. Allows searching on any RM or resource OBS instead of pre-filtering for the logged in user.


Copyright 2023 • Rego Consulting Corporation • Privacy Policy