-
 A review of how Northern Trust integrates financial systems with Clarity PPM bilaterally, providing the Finance organization crucial information, and NT Project Managers with a birds-eye view of project financials. Utilizing the Rego Data Extractor and the Rego Data Processor, these information exchanges help Portfolio and Project Managers eliminate their manual and redundant efforts, solidify their overall data accuracy, and dramatically improve the content provided to their Execs for decision-making.
 -
 A presentation slide deck from Rego University 2022. The course outline document for the creation of NSQL Portlets for Clarity.
- Multi-Dimensional Portlets
- NSQL Syntax
- Creating a sample portlet
- Limitations
- Common errors and best practices
- Hierarchical Portlets
- NSQL Syntax
- Creating a sample portlet
- Limitations and best practices
- Multi-Dimensional Portlets
-
 This view depicts the Resource Utilization by comparing actual hours booked as a percentage of total resource availability grouped and totaled by OBS Unit in a hierarchical fashion. Resource availability is determined by the working days and daily availability on the individual Resource Calendar and is depicted on a Monthly basis. This portlet uses Monthly Times and the Time Slice job may need to run before the end user will see results in the portlet. The portlet filters for Project Activity, Resource Open for Time, Resource Activity, and Employment time have been added to OBS Type and the Start and Finish dates.
 -

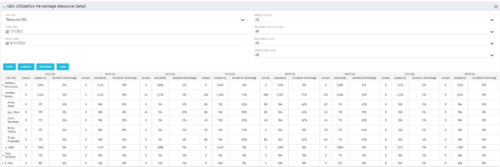 This portlet depicts the Resource Utilization by comparing actual hours booked as a percentage of total resource availability grouped and totaled by OBS Unit in a hierarchical fashion. Resource availability is determined by the working days and daily availability on the individual Resource Calendar and is depicted on a Monthly basis. This portlet uses Monthly Times and the Time Slice job may need to run before the end user will see results in the portlet. The portlet filters for Project Activity, Resource Open for Time, Resource Activity, and Employment time have been added to OBS Type and the Start and Finish dates. The OBS summary totals show on a single line, but can be clicked (+) to roll out the details behind each OBS total.
 -

 This portlet depicts the Resource Utilization by comparing actual hours booked as a percentage of total resource availability grouped and totaled by OBS Unit in a hierarchical fashion. Resource availability is determined by the working days and daily availability on the individual Resource Calendar and is depicted on a Monthly basis. This portlet uses Monthly Times and the Time Slice job may need to run before the end user will see results in the portlet. The portlet filters for Project Activity, Resource Open for Time, Resource Activity, and Employment time have been added to OBS Type and the Start and Finish dates. The OBS summary totals show on a single line, but can be clicked (+) to roll out the details behind each OBS total.
 -

 This portlet depicts the Resource Utilization by comparing actual hours booked as a percentage of total resource availability grouped and totaled by OBS Unit in a hierarchical fashion. Resource availability is determined by the working days and daily availability on the individual Resource Calendar and is depicted on a Monthly basis. This portlet uses Monthly Times and the Time Slice job may need to run before the end user will see results in the portlet. The portlet filters for Project Activity, Resource Open for Time, Resource Activity, and Employment time have been added to OBS Type and the Start and Finish dates. The OBS summary totals show on a single line, but can be clicked (+) to roll out the details behind each OBS total.
 -
 The Open and Close Periods process closes the earliest open time period and opens the first closed time period after the latest open time period. This process may be used for a non-administrator to open and close time periods without having access to the administrative side. The process is executed through the job Execute Process. For example, our oldest time period is January 6, and our most recent is May 1, it would close out January 6, and open a time period for the week after May 1.
 -
 The Open and Close Periods process closes the earliest open time period and opens the first closed time period after the latest open time period. This process may be used for a non-administrator to open and close time periods without having access to the administrative side. The process is executed through the job Execute Process. For example, our oldest time period is January 6, and our most recent is May 1, it would close out January 6, and open a time period for the week after May 1.
 -
 The Open and Close Periods process closes the earliest open time period and opens the first closed time period after the latest open time period. This process may be used for a non-administrator to open and close time periods without having access to the administrative side. The process is executed through the job Execute Process. For example, our oldest time period is January 6, and our most recent is May 1, it would close out January 6, and open a time period for the week after May 1.
 -
 A Rego training deck that walks through the various aspects of Open Workbench and offers tips and trick on using the tool to manage projects in sync with Clarity. Covers: Opening a plan, Multiple Staffing, Preference Options, Quick Access Toolbar, Quick Search and Quick Filter, Views and Filters, Copying Plans, Work Breakdown Structure, Dependencies, Assignments, Autoschedule, Baselining and Plan Closure.
 -
 Do you want to know more about building outbound integrations using a flat file placed on an SFTP Server? Does your organization have an external BI tool like Cognos, Tableau, Domo, or Qlikview? This session will review strategies for getting data into your corporate BI tools. We will also show Rego's data extraction tool and how it can be used for all outbound file-based integrations to save money and time.
 -

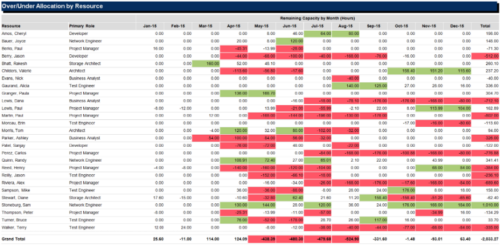 The Over/Under Allocation by Resource report is a transaction based Jaspersoft report that does not require the Load Jaspersoft Datawarehouse job to be run. The report will pull real-time data from the transaction tables in Clarity. This report can be run from either the Advanced Reporting or Reports and Jobs area within Clarity. The Over/Under Allocation by Resource report displays resource remaining capacity amounts by resource. The report displays amounts by week or month, and in total. The amounts can be displayed as hours or FTEs.

