-
 The Pending Contractor Termination Stalker process sends email to Resource Manager if the Contractor(s) termination date is 3 weeks or less. This is an On Demand process in Clarity named Contractor Reminders and can be manually executed from the Organizer. If there are number of processes in the Organizer – Available Processes, this process can be filtered and then checked to Start. When Contractor Reminders process is started it will be seen in the Initiated on the Processes tab. The process status can be monitored from Running to the Completed stage. The Progress when 100% and the Status is Completed an email would have arrived to the Resource Manager with subject: “Contractor(s) With Termination Date in 3 weeks or less”. This email will list the Contractors whose contracts will terminate on the identified date.
 -
 Course Description: Are your reports and portlets performing well? This class will walk you through specific SQL tuning tricks to make queries run faster, increase end user satisfaction, and smooth-out system performance. This is an easy way to promote efficient future development and make a huge, positive impact on user experience.
 -
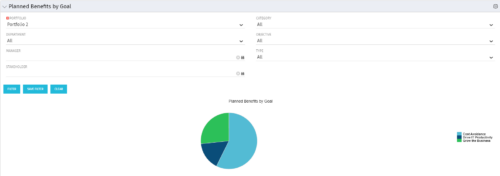 Part of the Business Transformation Package, this pie chart portlet shows planned benefits across the system grouped by Goal. The data is displayed form the investments in a portfolio. The portlet lets the Portfolio Manager know on which GOAL the planned benefit is allocated, so as to target the overall investment spread in the portfolio.
 -
 Part of the Business Transformation Package, this pie chart portlet shows planned benefits across the system grouped by Goal. The data is displayed form the investments in a portfolio. The portlet lets the Portfolio Manager know on which GOAL the planned benefit is allocated, so as to target the overall investment spread in the portfolio.
 -
 Part of the Business Transformation Package, this pie chart portlet shows planned benefits across the system grouped by Goal. The data is displayed form the investments in a portfolio. The portlet lets the Portfolio Manager know on which GOAL the planned benefit is allocated, so as to target the overall investment spread in the portfolio.
 -
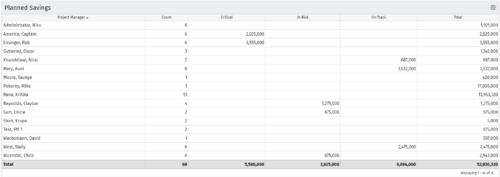
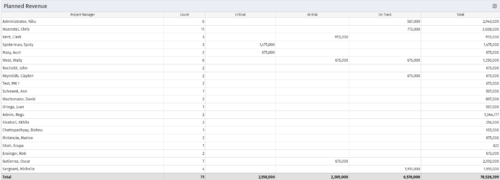 Part of the Business Transformations collection, this portlet displays planned revenue as defined by a project whose goal is "Grow the business". It uses the Planned Revenue Query as a data provider. This portlet provides a holistic overview of how many projects following the goal “Grow the Business” are Critical/ At Risk / On Track with regard to the planned revenue.
 -
 Part of the Business Transformations collection, this portlet displays planned revenue as defined by a project whose goal is "Grow the business". It uses the Planned Revenue Query as a data provider. This portlet provides a holistic overview of how many projects following the goal “Grow the Business” are Critical/ At Risk / On Track with regard to the planned revenue.
 -
 Part of the Business Transformations collection, this portlet displays planned revenue as defined by a project whose goal is "Grow the business". It uses the Planned Revenue Query as a data provider. This portlet provides a holistic overview of how many projects following the goal “Grow the Business” are Critical/ At Risk / On Track with regard to the planned revenue.
 -
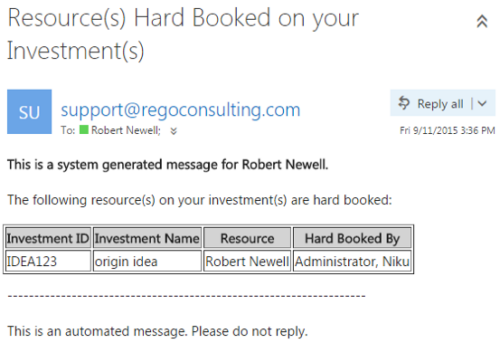 This notification process sends an email to the Manager of an investment (Project, Application, Idea, etc) when the resource assigned to the team has been hard booked. The process should be scheduled to run on a daily basis as the logic in it looks to all resources where their Booking Status has been changed from Soft to Hard on the day that the process is run. It compares the audit trail date change field to the system date. If the process is not scheduled to run daily no notification will occur on hardbookings from previous days.
 -
 This notification process sends an email to the Manager of an investment (Project, Application, Idea, etc) when the resource assigned to the team has been hard booked. The process should be scheduled to run on a daily basis as the logic in it looks to all resources where their Booking Status has been changed from Soft to Hard on the day that the process is run. It compares the audit trail date change field to the system date. If the process is not scheduled to run daily no notification will occur on hardbookings from previous days.
 -
 This notification process sends an email to the Manager of an investment (Project, Application, Idea, etc) when the resource assigned to the team has been hard booked. The process should be scheduled to run on a daily basis as the logic in it looks to all resources where their Booking Status has been changed from Soft to Hard on the day that the process is run. It compares the audit trail date change field to the system date. If the process is not scheduled to run daily no notification will occur on hardbookings from previous days.
 -
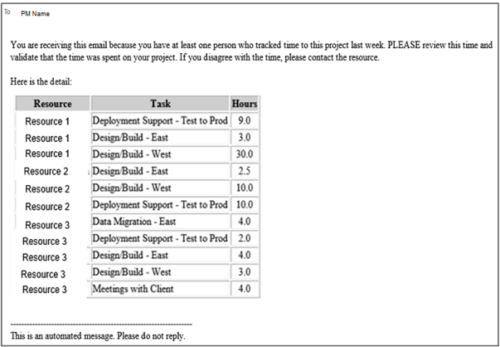
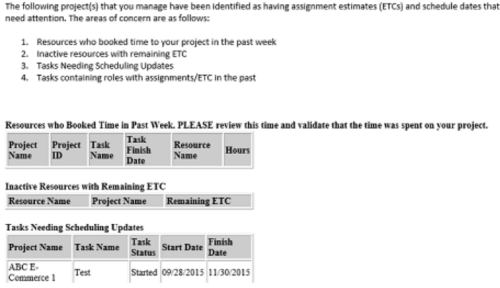 “PM Stalker – Project Validations & Issues” executes various queries against the Clarity database and sends an email to all PMs who have one or more projects with any of the following conditions:
- Resources have booked time in the past week (validation needed)
- Inactive Resources with ETCs still on the project
- Tasks past their Finish Date but not completed
- Task Role Assignments in the past
-
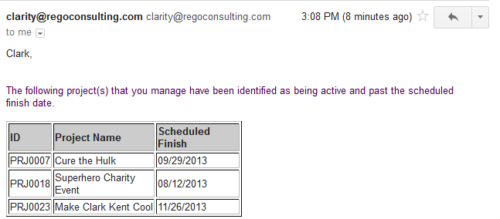 Based on the pre-determined schedule frequency, this job will send an email to Project Managers that have a project meeting the criteria of: project(s) are active and scheduled finish date is less than the current date. This serves as a reminder to Project Managers to keep their schedules true. The contents of the email include a message indicating the project manager has at least one project meeting this criteria and a table indicating the Project ID, Project Name and Scheduled Finish Date.
 -
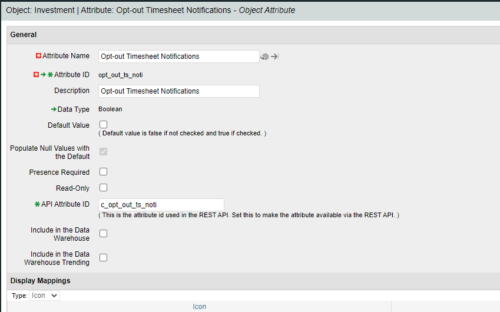
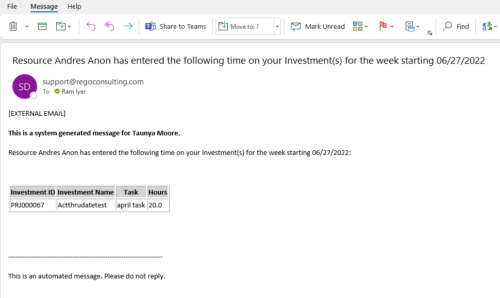 Notify the PM with a list of tasks for their project as soon as the Timesheet is submitted. This is a good substitute for PM approval. When a timesheet is submitted, then the PM knows the time entered by person. This is an Auto-start process in Clarity named PM Time Notification - On Timesheet Submission and will be automatically spawned when a Timesheet is submitted. When the process is started it will be seen in the Initiated on the Processes tab. The process status can be monitored from Running to the Completed stage. The Progress when 100% and the Status is Completed, an email would have arrived to the Project Manager with subject: “Resource <Name> has entered the following time on your Investment(s) for the week starting <Timesheet Start Date> ”. This email will list the Investments managed by the PM where task was entered by the Resource submitting the timesheet. Each PM would get a separate notification. PM for project X notified, and PM for project Y gets notified in another email. Therefore, one timesheet may spawn out multiple emails. But, if both the Projects have the Same PM, then only a single email gets sent out. “Opt-out Timesheet Notifications" checkbox is provided on the Project for PM’s who do not want to get notified on those projects.
 -

 Notify the PM with a list of tasks for their project as soon as the Timesheet is submitted. This is a good substitute for PM approval. When a timesheet is submitted, then the PM knows the time entered by person. This is an Auto-start process in Clarity named PM Time Notification - On Timesheet Submission and will be automatically spawned when a Timesheet is submitted. When the process is started it will be seen in the Initiated on the Processes tab. The process status can be monitored from Running to the Completed stage. The Progress when 100% and the Status is Completed, an email would have arrived to the Project Manager with subject: “Resource <Name> has entered the following time on your Investment(s) for the week starting <Timesheet Start Date> ”. This email will list the Investments managed by the PM where task was entered by the Resource submitting the timesheet. Each PM would get a separate notification. PM for project X notified, and PM for project Y gets notified in another email. Therefore, one timesheet may spawn out multiple emails. But, if both the Projects have the Same PM, then only a single email gets sent out. “Opt-out Timesheet Notifications" checkbox is provided on the Project for PM’s who do not want to get notified on those projects.
 -

 Notify the PM with a list of tasks for their project as soon as the Timesheet is submitted. This is a good substitute for PM approval. When a timesheet is submitted, then the PM knows the time entered by person. This is an Auto-start process in Clarity named PM Time Notification - On Timesheet Submission and will be automatically spawned when a Timesheet is submitted. When the process is started it will be seen in the Initiated on the Processes tab. The process status can be monitored from Running to the Completed stage. The Progress when 100% and the Status is Completed, an email would have arrived to the Project Manager with subject: “Resource <Name> has entered the following time on your Investment(s) for the week starting <Timesheet Start Date> ”. This email will list the Investments managed by the PM where task was entered by the Resource submitting the timesheet. Each PM would get a separate notification. PM for project X notified, and PM for project Y gets notified in another email. Therefore, one timesheet may spawn out multiple emails. But, if both the Projects have the Same PM, then only a single email gets sent out. “Opt-out Timesheet Notifications" checkbox is provided on the Project for PM’s who do not want to get notified on those projects.

