-
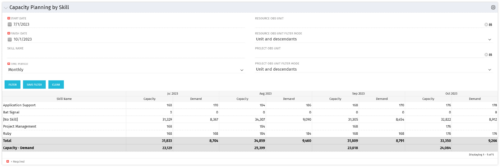 The Capacity Planning by Skill portlet displays the capacity and demand by skill for a selected timeframe. This portlet is used to determine which skills are in high demand, being used efficiently, and how much capacity may be remaining for the time period. The portlet may be filtered by skill name, resource OBS or project OBS to narrow the results.
 -
The Capacity Planning by Skill portlet displays the capacity and demand by skill for a selected timeframe. This portlet is used to determine which skills are in high demand, being used efficiently, and how much capacity may be remaining for the time period. The portlet may be filtered by skill name, resource OBS or project OBS to narrow the results.
-
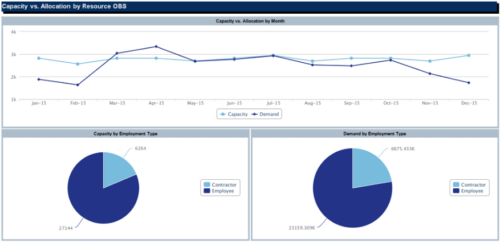
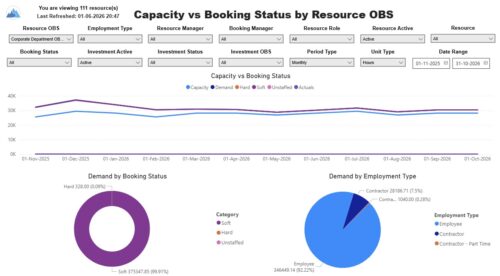 The Capacity vs. Booking Status by OBS report includes three charts. The line chart displays capacity compared to demand, with demand distributed by booking status, and actuals by period. The pie charts display demand by booking status and demand by employment type. The report also includes a detail listing of resource capacity and demand at the booking status level across investments. The report can be grouped by any OBS level, providing visibility into resources at any level of the organization. The report displays amounts by week or month, and in total. The amounts can be displayed as hours or FTEs. Report Prerequisites Verify that you have completed the following prerequisites before you run this report: • Resource capacity amounts display if the resource has availability that is defined and meets the parameter criteria. • Resource demand allocation amounts display if the resource is allocated to at least one investment. Resource assignments are not required. • The Load Data Warehouse job must be run before you run this report. If the Data Warehouse is not populated, the report will not display any data. Also, most of the report parameters do not display options.
 -
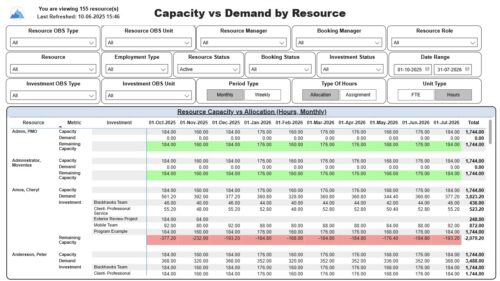 The Capacity vs. Demand by Resource report displays resource capacity and demand at the resource level across investments. The report gives you visibility into the capacity, demand, and remaining capacity by resource. The report displays amounts by week or month, and in total. The amounts might be displayed as hours or FTEs. Report Prerequisites: Verify that you have completed the following prerequisites before you run this report: • The Load Data Warehouse job must be run before you run this report. If the Data Warehouse is not populated, the report will not display any data. Also, most of the report parameters do not display options. • Resource demand allocation amounts display if the resource is allocated to at least one investment and the report display type of hours as allocations. Resource demand assignment amounts display if the resource is assigned to at least one task on the investment and the report displays type of hours as assignments.
 -
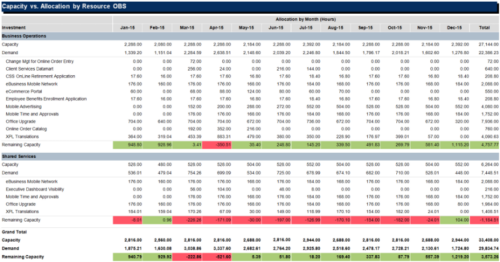
 The Capacity vs Allocation by OBS report is a transaction based Jaspersoft report that does not require the Load Jaspersoft Datawarehouse job to be run. The report will pull real-time data from the transaction tables in Clarity. This report can be run from either the Advanced Reporting or Reports and Jobs area within Clarity. The Capacity vs. Allocation by OBS report displays resource capacity and demand across investments. The report can be grouped by any OBS level, providing visibility into resources at any level of the organization. The report displays amounts by week or month, and in total. The amounts can be displayed as hours or FTEs.
 -
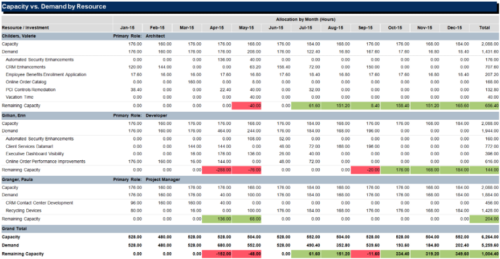 The Capacity vs Demand by Resource report is a transaction based Jaspersoft report that does not require the Load Jaspersoft Datawarehouse job to be run. The report will pull real-time data from the transaction tables in Clarity. This report can be run from either the Advanced Reporting or Reports and Jobs area within Clarity. The Capacity vs. Demand by Resource report displays resource capacity and demand at the resource level across investments. The report gives you visibility into the capacity, demand, and remaining capacity by resource. The report displays amounts by week or month, and in total. The amounts might be displayed as hours or FTEs.
 -
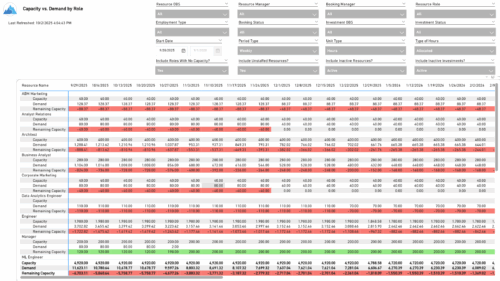 The Capacity vs. Demand by Role report provides visibility into resource utilization by comparing available capacity to actual demand across investments at the role level. It highlights capacity, demand, and remaining capacity, helping identify potential surpluses or shortfalls. Data can be viewed by week or month and displayed in either hours or full-time equivalents (FTEs) to support detailed workforce planning and analysis.
 -
 A presentation slide deck from Rego University 2022. This document reviews the best practices around change and impact management.
- Introduction
- Change and Impact Basics
- How did we get here?
- Demo and Discussion
-
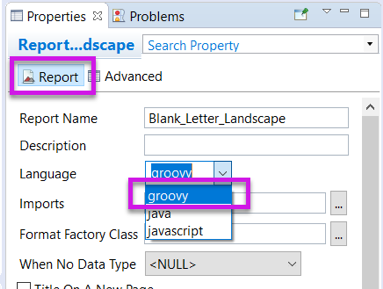 Changing the report programming language can allow the report developer to use other languages (such as Groovy or Javascript) instead of Java methods in expressions. This can be useful in debugging report code.
 -
 Prosci presents concepts on changing Portfolio Management. They share their approach on the people side of PfM, with a goal of addressing the saturation and collision of multiple projects, initiatives or work efforts.
 -
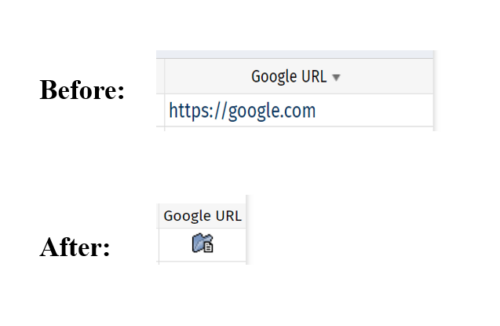 This tech-trick defines how a URL attribute can be changed to an image in a list view via CSS.
 -
 The Changing Application Logo and Title tech trick provides an overview of how to change the logo and title within the application. This allows administrators to rebrand Clarity to their own logo and title. By customizing the logo, employees may be more encouraged to take ownership of the tool.


Copyright 2023 • Rego Consulting Corporation • Privacy Policy