-
 This session will align you with best practices for using Clarity's resource management functionality. Come and learn about the OOTB capabilities for resource insights like allocations, assignments, availability, and more. Additionally, tips and tricks will be shared, providing you with a toolkit of ideas for your organization!
 -
 A Quick Reference Guide to assist in the administrative process of creating a new Clarity OBS. An Organizational Breakdown Structure (OBS) is a hierarchical structure that can be used to align resources, projects and investments. An OBS can be used for reporting and access control based on OBS membership. Note: the following steps apply when creating a non-financial OBS. The financial OBS (Department and Location OBS) are generally setup as part of the Clarity implementation.
 -
This training document is a Rego Consulting Quick Reference Guide to assist with the management of the Card View within Hierarchies in Clarity’s Modern User Experience. This doc references version 16.3 views. Document provides detail on View Options, Color By, Card Fields and Card Metrics. Information on how to roll up metrics via an aggregation or calculation method.
-
 Do you want to know more about building integrations quickly and easily? We will also show Rego's data processor and extraction tool and how it can be used for all outbound file-based integrations to save money and time.
 -
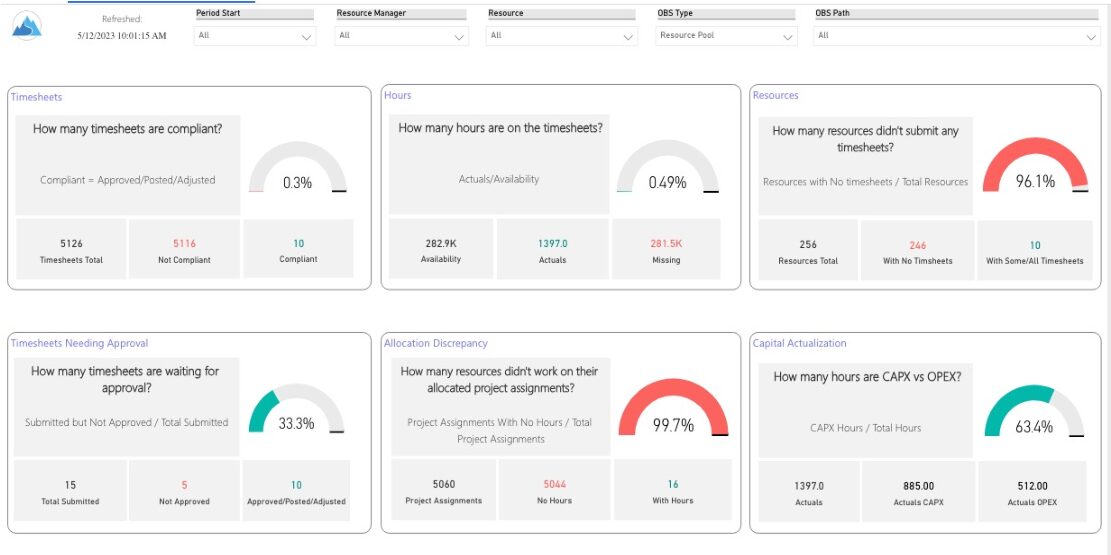 Spot opportunities to improve timesheet accuracy and resource allocations by assessing timesheet compliance and allocation. Report Views include: • Allocation Variance • Capex vs Opex • Hours Detail • Resource Dtails • Single Manager Drill Down • Single Resource Drill Down • Timesheet Detail • Timesheet Summary • Unapproved Timesheets Demo Video: https://www.youtube.com/watch?v=yxIkkqSyrRU&list=PLXJ5ktuWV0jiS9CvBpHvBIwpKPmA9uvwK&index=8
 -
 This training document is a Rego Consulting Quick Reference Guide to assist with resource staffing in Clarity’s Modern User Experience. The document reviews accessing Staffing from the main menu, the Staffing Grid, and the Allocations Timeline.
 -
 A Quick Reference Guide that assists in managing project tasks in Clarity’s Modern UX via the Classic Gantt. Reviews how to open the Project Scheduler and use of the Gantt View.
 -
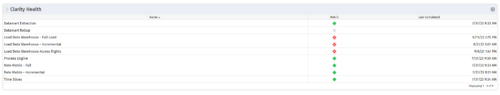 The Clarity Health portlet provides a quick glance into the health of key components and critical jobs in the Clarity environment. The following metrics are monitored: Process Engine Heartbeat should refresh itself every 10 minutes. Process Engine is responsible for the triggering of processes. Green <= 10 Minutes, Yellow 11-15 Minutes, Red > 15 Minutes Time Slices Time Slices are required for accurate reporting. Best practice is for the Time Slicing job to run every minute. Please note there are some jobs that will cause the time slicing to delay so a momentary delay is normal. Green <= 10 Minutes, Yellow 11-15 Minutes, Red > 15 Minutes Datamart Extraction Green <= 24 Hours, Yellow 24-48 hours, Red > 48 hours Datamart Rollup Green <= 24 Hours, Yellow 24-48 hours, Red > 48 hours Rate Matrix - Full Best practice is to run a full rate matrix nightly Green <= 24 Hours, Yellow 24-48 hours, Red > 48 hours Rate Matrix - Incremental Green <= 24 Hours, Yellow 24-48 hours, Red > 48 hours Load Data Warehouse - Full Load Green <= 24 Hours, Yellow 24-48 hours, Red > 48 hours Load Data Warehouse - Incremental Green <= 24 Hours, Yellow 24-48 hours, Red > 48 hours Load Data Warehouse Access Rights Green <= 24 Hours, Yellow 24-48 hours, Red > 48 hours
 -
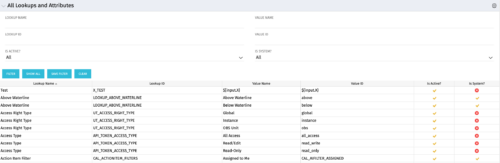 The All Lookups and Attributes portlet provides the ability to see all static lookups in the system, as well as their lookup values. Ability to filter and view the population by lookup name and ID, value name and ID, whether or not the item is active, and whether or not the item is a system (seeded) value. A system value is a record that comes with a base installation of Clarity as opposed to a value that was added manually or through a Clarity Add-in.
 -

A presentation slide deck from Rego University 2022. This document reviews the best practices for Financial Management in Clarity. - Involve the Finance Team
- Finance will drive financial classifications, resource rates, and capitalization rules
- Keep Things as Simple as Possible
- Streamline financial classifications in both the Estimation and Actuals processes
- Clarity is Not the Company’s Financial System of Record – it is a Project and Portfolio Management System
- Clarity may never match general ledger or project accounting module 100%
- Spend Time on the Full Architecture – Current and Future State
- Start With Required Outputs and Work Backward
- Integrate to Avoid Duplicate Entry
- Involve the Finance Team
-
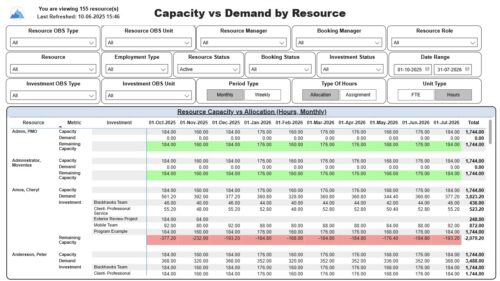 The Capacity vs. Demand by Resource report displays resource capacity and demand at the resource level across investments. The report gives you visibility into the capacity, demand, and remaining capacity by resource. The report displays amounts by week or month, and in total. The amounts might be displayed as hours or FTEs. Report Prerequisites: Verify that you have completed the following prerequisites before you run this report: • The Load Data Warehouse job must be run before you run this report. If the Data Warehouse is not populated, the report will not display any data. Also, most of the report parameters do not display options. • Resource demand allocation amounts display if the resource is allocated to at least one investment and the report display type of hours as allocations. Resource demand assignment amounts display if the resource is assigned to at least one task on the investment and the report displays type of hours as assignments.


Copyright 2023 • Rego Consulting Corporation • Privacy Policy