-
 The Financial Budget vs. Forecast by Period Detail report provides a detailed breakdown of planned or budgeted costs compared to forecasted costs by investment. It displays variances for each period and in total. Users can filter or drill down to view the specific investments that contribute to selected financial plan groupings.
 -
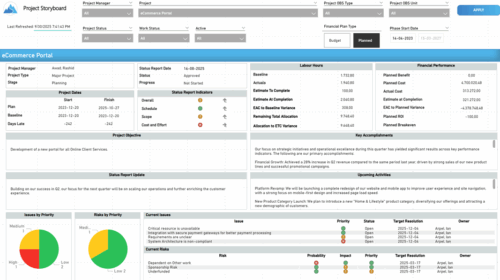 The Time Compliance report displays different frame in the displaying project information such as project dates, project objective, the amount, and cost of resources that are planned and actual, key accomplishments, upcoming activities, current issues and risks, and the project progress toward goals, and some EVM indicators for its phases.
 -
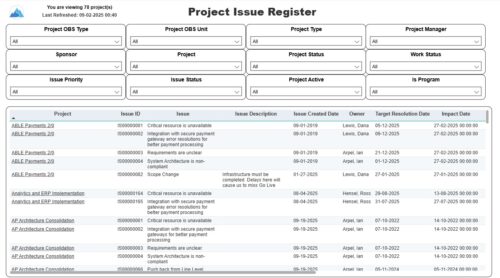 The Project Issue Register report displays comprehensive information for each project issue. The issue register also provides the option to display items that are associated to the issue such as notes, action items, and tasks. Report Prerequisites Verify that you have completed the following prerequisites before you run this report: • The project must have at least one issue for the project to display in the report. • The issue properties must have fields such as description, category, resolution, target resolution, impact date, and originating ID completed for them to display data in the report. The issue name, issue ID, priority, status, and owner are required in Classic PPM so they always display data.
 -
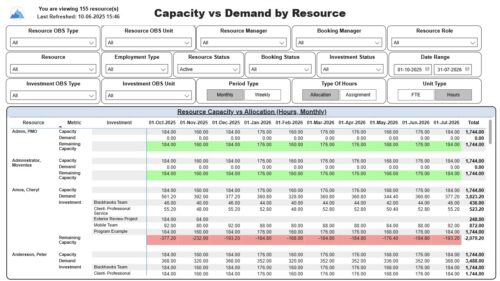 The Capacity vs. Demand by Resource report displays resource capacity and demand at the resource level across investments. The report gives you visibility into the capacity, demand, and remaining capacity by resource. The report displays amounts by week or month, and in total. The amounts might be displayed as hours or FTEs. Report Prerequisites: Verify that you have completed the following prerequisites before you run this report: • The Load Data Warehouse job must be run before you run this report. If the Data Warehouse is not populated, the report will not display any data. Also, most of the report parameters do not display options. • Resource demand allocation amounts display if the resource is allocated to at least one investment and the report display type of hours as allocations. Resource demand assignment amounts display if the resource is assigned to at least one task on the investment and the report displays type of hours as assignments.
 -
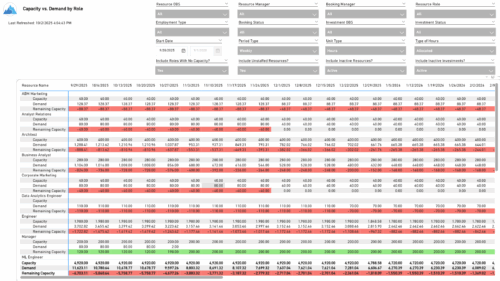 The Capacity vs. Demand by Role report provides visibility into resource utilization by comparing available capacity to actual demand across investments at the role level. It highlights capacity, demand, and remaining capacity, helping identify potential surpluses or shortfalls. Data can be viewed by week or month and displayed in either hours or full-time equivalents (FTEs) to support detailed workforce planning and analysis.
 -
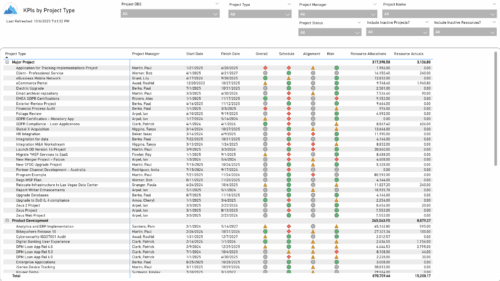 The KPIs by Project Type report provides a consolidated view of key performance indicators across projects, grouped by project type. It highlights metrics such as overall status, schedule, alignment, and risk, along with resource allocation and actual hours tracked since each project’s inception. This report enables quick comparison of performance trends and resource utilization across different project types.
 -
 The Resource Time Review by Manager report provides visibility into timesheet entries for each resource, organized by investment manager or resource manager. It details hours entered by day and in total for each investment and time entry, helping managers monitor time allocation and utilization across their teams. This report supports effective oversight of resource effort and project participation.
 -
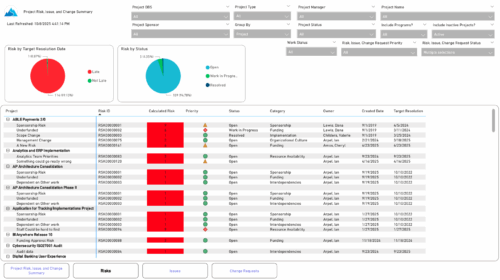 The Project Risk, Issue, and Change Summary report provides an overview of project health by visualizing risks, issues, and change requests. It includes pie charts that display counts by target resolution or expected close date, as well as by status. A detailed table lists each item’s name, ID, priority, status, category, owner, creation date, and resolution or close date. Results can be grouped by project or viewed without grouping to support flexible analysis and tracking.
 -
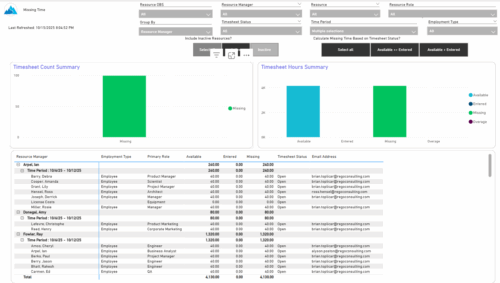 The Missing Time report provides insight into timesheet compliance by comparing available hours, entered hours, and missing hours for each resource over a selected time period. It can be grouped by resource manager or OBS level and offers flexibility to calculate missing time based on timesheet status or resource availability. The report includes summary charts showing timesheet completion rates and total hours, highlighting completed, partial, and missing timesheets as well as overages across reporting periods.
 -
 The Project Status Detail report provides a comprehensive view of each project’s key elements, including team allocations, major milestones, risks, issues, and change requests. It highlights the most relevant project indicators to give stakeholders a clear understanding of project health and progress. This report supports detailed tracking and review of project performance across multiple dimensions.
 -
 The Time Compliance Detail report displays the timesheet status by resource, their email, employment type, and resource manager, in their respective OBS.
 -
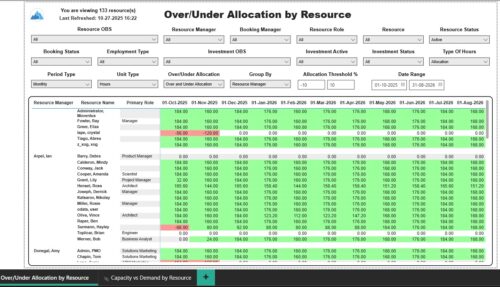 The Over/Under Allocation by Resource report displays resource remaining capacity amounts by resource. The report displays amounts by week or month. The amounts can be displayed as hours or FTEs. This report allows you to drill down to the Capacity vs. Demand by Resource report, by clicking a resource name, to see more information about the resource capacity and demand. Report Prerequisites Verify that you have completed the following prerequisites before you run this report: • The Load Data Warehouse job must be run before you run this report. If the Data Warehouse is not populated, the report will not display any data. Also, most of the report parameters do not display options.


Copyright 2023 • Rego Consulting Corporation • Privacy Policy