-
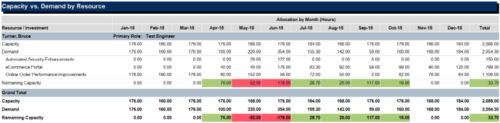
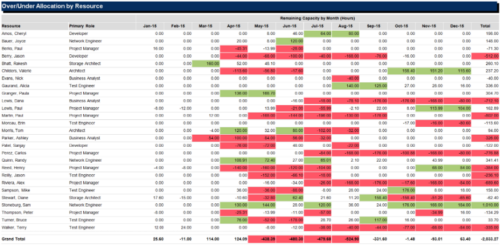 The Over/Under Allocation by Resource report is a transaction based Jaspersoft report that does not require the Load Jaspersoft Datawarehouse job to be run. The report will pull real-time data from the transaction tables in Clarity. This report can be run from either the Advanced Reporting or Reports and Jobs area within Clarity. The Over/Under Allocation by Resource report displays resource remaining capacity amounts by resource. The report displays amounts by week or month, and in total. The amounts can be displayed as hours or FTEs.
 -
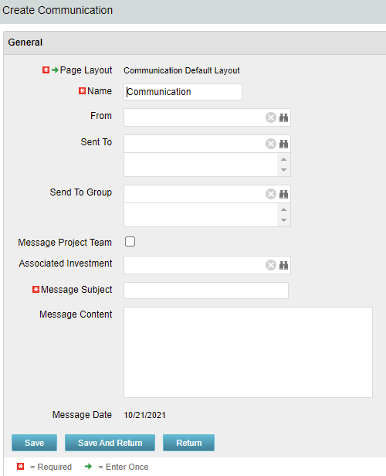 The Communications Object allows a user to send an html-based email to all users on a project, in a security group, or to individual users directly from Clarity. An email can be sent by creating a new entry on the Communication List page, upon saving a new entry the email process with trigger and send the email. Auto Start Solution: An email can be sent by creating a new entry on the Communication List page, upon saving a new entry the email process with trigger. On Demand Solution: All emails could be sent together as a broadcast communication by running the process manually from the Organizer. This process could also be scheduled to run on a specific time using Jobs The table below describes the available columns on the object.
Either of the on-demand process or auto start process should be active at a time. The package provides two Processes: 1. Send Notification (ID:rego_send_notification) This is an auto start process. The notification is sent immediately when a new entry is created on the Communication object. Only one email notification will be sent for one entry. Any updates to the same entry will not trigger any new notifications. 2. Email Communication (ID:rego_email_comm) This is an on-demand process that could be run from the Organizer. This send notification to all the entries on the Communication objects for which a communication was not already sent. This process does not have a Primary object. The processes are designed to work both in Oracle and Postgres environment. If the DB vendor information from Properties.xml is Postgres the SQL query for Postgres will be called. If not, the default SQL is Oracle. Important Note: Either of the processes should be active for an Implementation. If both the processes are active the on-demand process has no effect and will never send any communication. All object entries have a sent flag which will be marked whenever a notification is sent. Both the processes set the same flag on the object instance. Only with admin DB rights this flag could be overwritten. Object Name:Communication Object ID: rego_communication Flag Attribute Name: Sent (Id: rego_sent)Column Label Description From Who the email is coming from Sent To Individual users the message should send to Send to Group Security groups the message should send to (users within the security groups) Message Project Team Should this message be sent to a project team Associated Investment If Message Project Team is checked, which project should the team list be pulled from Message Subject Subject line of the email Message Content Body of the email (html) Message date Internal code used by the query -
The Communications Object allows a user to send an html-based email to all users on a project, in a security group, or to individual users directly from Clarity. An email can be sent by creating a new entry on the Communication List page, upon saving a new entry the email process with trigger and send the email. Auto Start Solution: An email can be sent by creating a new entry on the Communication List page, upon saving a new entry the email process with trigger. On Demand Solution: All emails could be sent together as a broadcast communication by running the process manually from the Organizer. This process could also be scheduled to run on a specific time using Jobs The table below describes the available columns on the object.
Either of the on-demand process or auto start process should be active at a time. The package provides two Processes: 1. Send Notification (ID:rego_send_notification) This is an auto start process. The notification is sent immediately when a new entry is created on the Communication object. Only one email notification will be sent for one entry. Any updates to the same entry will not trigger any new notifications. 2. Email Communication (ID:rego_email_comm) This is an on-demand process that could be run from the Organizer. This send notification to all the entries on the Communication objects for which a communication was not already sent. This process does not have a Primary object. The processes are designed to work both in Oracle and Postgres environment. If the DB vendor information from Properties.xml is Postgres the SQL query for Postgres will be called. If not, the default SQL is Oracle. Important Note: Either of the processes should be active for an Implementation. If both the processes are active the on-demand process has no effect and will never send any communication. All object entries have a sent flag which will be marked whenever a notification is sent. Both the processes set the same flag on the object instance. Only with admin DB rights this flag could be overwritten. Object Name:Communication Object ID: rego_communication Flag Attribute Name: Sent (Id: rego_sent)Column Label Description From Who the email is coming from Sent To Individual users the message should send to Send to Group Security groups the message should send to (users within the security groups) Message Project Team Should this message be sent to a project team Associated Investment If Message Project Team is checked, which project should the team list be pulled from Message Subject Subject line of the email Message Content Body of the email (html) Message date Internal code used by the query -
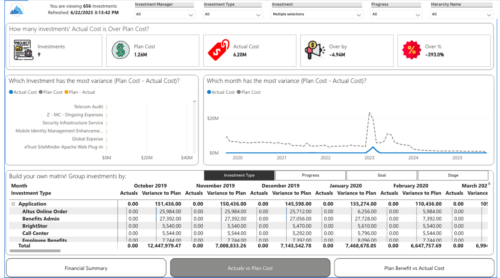
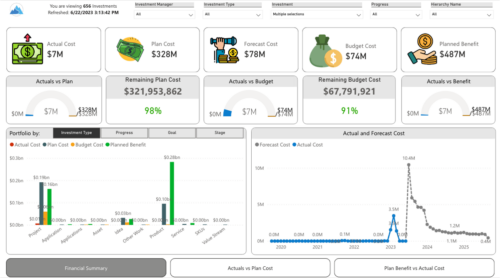 Gain a financial view of your investments by comparing actuals to planned cost and planned benefit. Report views include:
- Financial Summary
- Planned Benefit vs Actual Cost
- Actuals vs Planned Costs
-
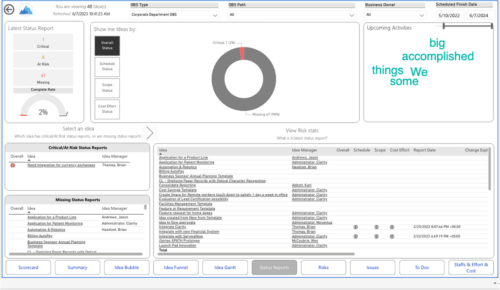
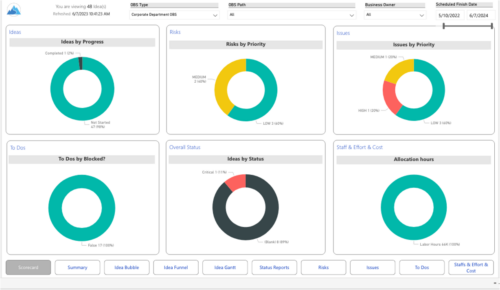 Master your pipeline as you prioritize, visualize, and analyze ideas, assess their feasibility, and track progress from inception to execution. Report Views include:
- Idea Bubble
- Idea Details
- Idea Funnel
- Idea Gantt
- Idea Overview
- Idea Staff and Effort
- Idea Status
- Idea To Dos
-
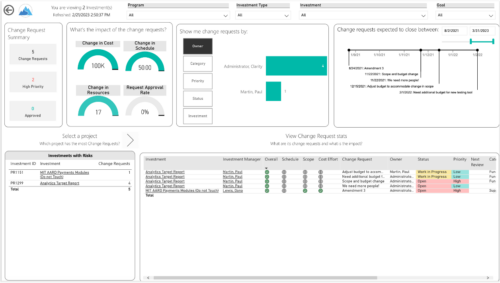
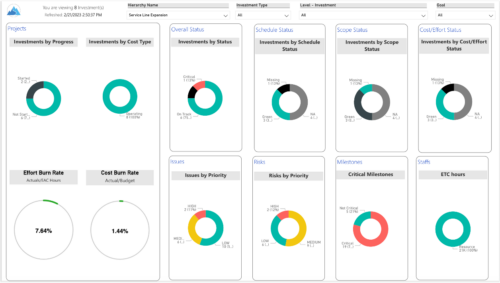 Summarize an ad hoc list of investments or leverage your defined hierarchies to visualize and evaluate the performance of your portfolios, including financial data analysis. Report Views include:
- Change Requests
- Cost Trend
- Cost
- Effort Trend
- Effort
- Hierarchy Summary
- Investment Drill Thru
- Investment Gantt
- Issue Summary
- Milestones
- Risk Summary
- Staff
- Status Report Summary
- Tasks
-
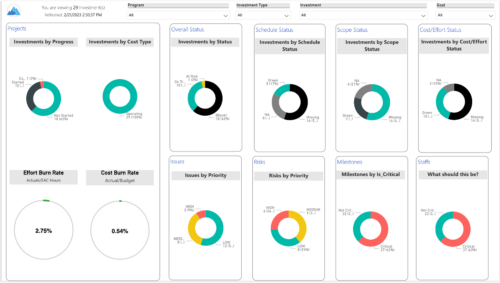 Gain an overview of program-level performance, track program milestones, and assess overall program health. Report Views include:
- Change Requests
- Program Costs Trend
- Program Costs
- Program Drill Thru
- Program Effort
- Program Gantt
- Program Issues
- Program Milestones
- Program Risks
- Program Staff
- Program Status Reports
- Program Summary
- Program Tasks
-
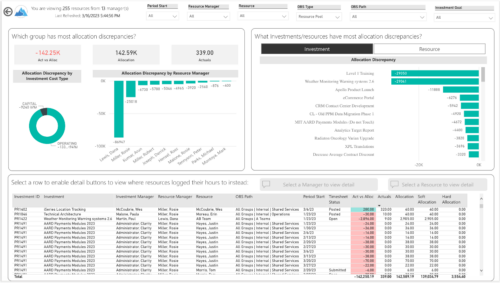
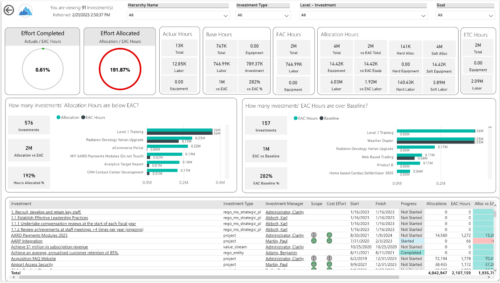
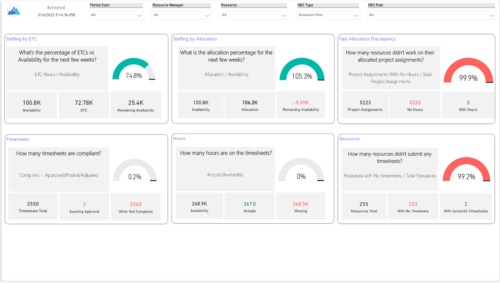 Evaluate resource allocations, identify bottlenecks, and ensure optimal resource utilization across projects and teams. Report Views include:
- Allocation Discrepancies
- Resource Detail
- Resource Skills
- Resource Summary
- Resource Tasks
- Staffing Allocations
- Staffing ETC
-
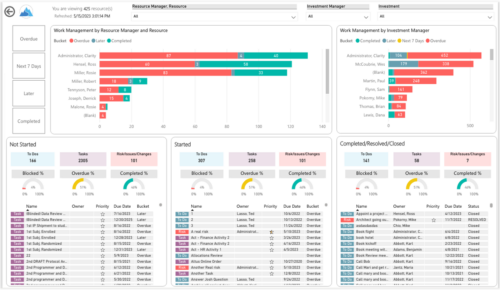
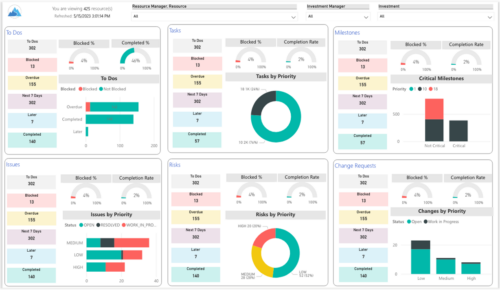 Make sure project deliverables are completed on time by tracking work progress and monitoring task assignments. Report Views include:
- Work Details
- Work Overview
- Work Risk Issue and Change
-
 The primary purpose of roles is to determine the amount of resource requests based on unapproved (uncommitted) and approved (committed) projects. Roles are non-named resources which are later allocated to named resources within CA PPM. Using roles is the best way to do "What If" scenario planning and determine needed capacity. This document assists in making Best Practice decisions around setting up roles in Clarity.
 -
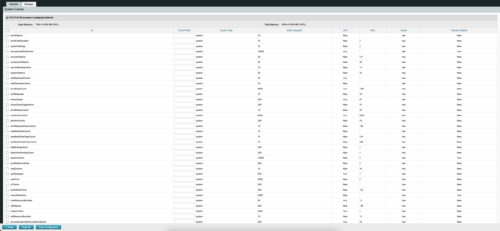
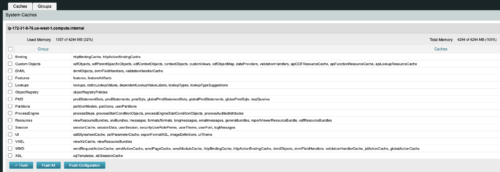 The CA Clarity Hidden Page Flush Caches document provides an overview of how to clear the cache on an application server without exiting the CA Clarity Application itself utilizing a hidden page within the system.


Copyright 2023 • Rego Consulting Corporation • Privacy Policy