-
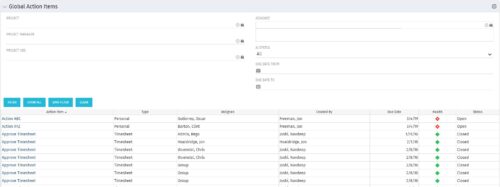 The Global Action Items portlet will help users and clarity admins to keep track of action items in the CA PPM system. This is useful to keep track of Timesheet Approval through Action Item or any other Action Item related workflows. The portlet displays Name, Type Assignee, Created by, Due Date, Health and Status of the Action Items as default columns. The portlet provides Project, Project Manager, Project OBS, Assignee, Status and Due Dates of the Action Items as default filters.
 -
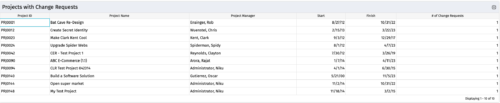
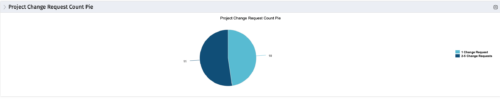 The portlet, Project Change Request Count Pie with drill-down is a simple pie that displays the total count of projects in the pie. The slices are:
- Projects with 0 change requests
- Projects with 1 change request
- Projects with 2-5 change requests
- Projects with 5-10 change requests
- Projects with over 10 change requests
-
The portlet, Project Change Request Count Pie with drill-down is a simple pie that displays the total count of projects in the pie. The slices are:
- Projects with 0 change requests
- Projects with 1 change request
- Projects with 2-5 change requests
- Projects with 5-10 change requests
- Projects with over 10 change requests
-
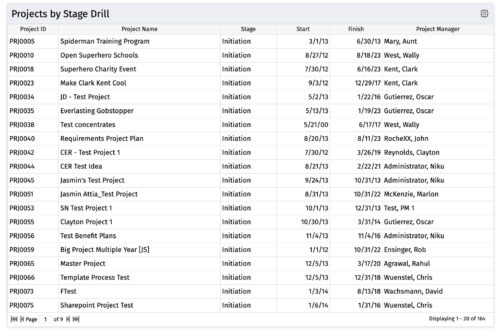
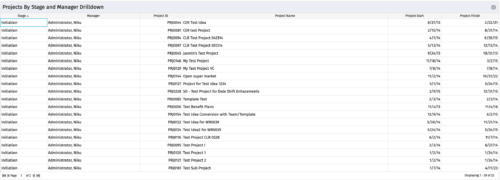
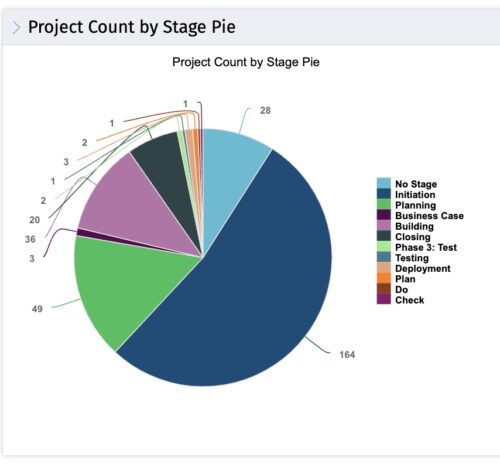 The portlet, Count by Stage with Drilldown is a simple pie based on stage OOTB field. The drill down portlet has stage as a column. Clicking on any of the segments, e.g. Initiation, redirects to the Projects by Stage Drill portlet.
 -
The portlet, Count by Stage with Drilldown is a simple pie based on stage OOTB field. The drill down portlet has stage as a column. Clicking on any of the segments, e.g. Initiation, redirects to the Projects by Stage Drill portlet.
-
The portlet, Count by Stage with Drilldown is a simple pie based on stage OOTB field. The drill down portlet has stage as a column. Clicking on any of the segments, e.g. Initiation, redirects to the Projects by Stage Drill portlet.
-
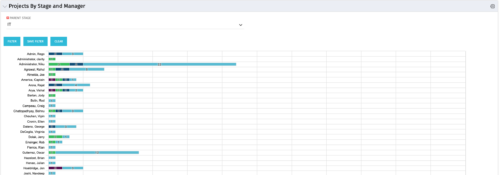 Horizontal Bar Chart displays one bar per manager (manager name on vertical axis). Horizontal axis shows project count. Filtered by Parent Stage. Each bar shows color coded stages, where length of each color is proportional to the count. Data label = count by stage. Mouse-over = stage name and percent count of total projects. Legend = child stage names. Drilldown functionality: Clicking on a bar color yields a project grid portlet with projects in that stage for that manager.
 -
Horizontal Bar Chart displays one bar per manager (manager name on vertical axis). Horizontal axis shows project count. Filtered by Parent Stage. Each bar shows color coded stages, where length of each color is proportional to the count. Data label = count by stage. Mouse-over = stage name and percent count of total projects. Legend = child stage names. Drilldown functionality: Clicking on a bar color yields a project grid portlet with projects in that stage for that manager.
-
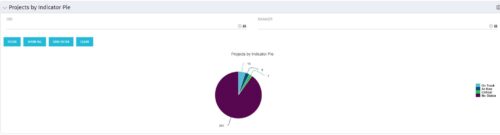 Pie Chart displays counts of all projects by out-of-box Status Indicator attributes. Filterable by OBS structure and Manager. Data label displays count. Mouse-over and Legend display Indicator name. Chart also displays count for projects with no Indicator.
 -
Pie Chart displays counts of all projects by out-of-box Status Indicator attributes. Filterable by OBS structure and Manager. Data label displays count. Mouse-over and Legend display Indicator name. Chart also displays count for projects with no Indicator.


Copyright 2023 • Rego Consulting Corporation • Privacy Policy