-
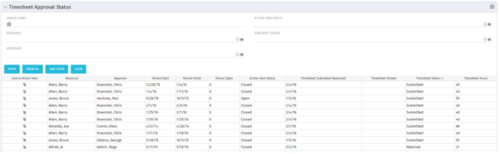 Portlet to show the stage of any Action Item triggered by Timesheet submission. Portlet allows for a period start date input, filters by Resource, Approver, Action Item Status and Timesheet Status. A link to the action item is provided for direct action by review if needed. This portlet is only for the clients who have established a process that triggers on Timesheet Status change to Submitted and to send Action Items to the person responsible for timesheet approval/validation i.e. PM for project tracking and/or RM for overall approval of the timesheet. The portlet won’t display any data if there are no timesheet Action Items. Examples of such processes would be CA’s OOTB Project Manager Approval or the Timesheet Approval - PM and RM process found on RegoXchange.
 -
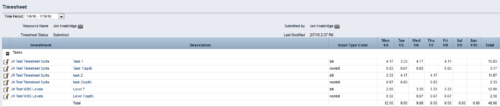
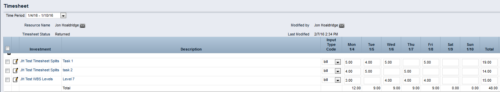
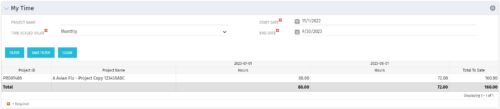 The My Time portlet provides the logged in user with the ability to view his or her time by project by time period without having to go into each period individually on the Timesheets page. This portlet uses the actual timeslices to retrieve data. It displays the amount of time worked per week, month or quarter on projects. The user may specify the dates, time-scaled value and the project name. The portlet also provides a Total to Date, which shows the total number of actuals for that resource on that assignment.
 -
The My Time portlet provides the logged in user with the ability to view his or her time by project by time period without having to go into each period individually on the Timesheets page. This portlet uses the actual timeslices to retrieve data. It displays the amount of time worked per week, month or quarter on projects. The user may specify the dates, time-scaled value and the project name. The portlet also provides a Total to Date, which shows the total number of actuals for that resource on that assignment.
-
 This training document is a Rego Consulting Quick Reference Guide to assist with Entering and Submitting Time in Clarity’s Modern User Experience. This doc references version 16.0.3 views. Document includes Accessing & Selecting Timesheets, Populate Timesheet, Updating Timesheet, Submitting Timesheet and Entering Time for Someone Else.
 -
 This training document is a Rego Consulting Quick Reference Guide to assist with Entering and Submitting Time in Clarity’s Modern User Experience. This doc references version 16.0.2 views. Document includes Accessing & Selecting Timesheets, Populate Timesheet, Updating Timesheet, Submitting Timesheet and Entering Time for Someone Else.
 -
 This training document is a Rego Consulting Quick Reference Guide to assist with Time Entry Administration Settings for Timesheets. This doc references version 16.0.2 views. Document provides detail on Timesheet Options for the Modern UX and how to enable end user column configuration. Detail is also provided on how end users may configure their timesheet view.
 -
 This video reviews the process of creating Timesheet Adjustments – making changes to a timesheet after it has been posted.
 -
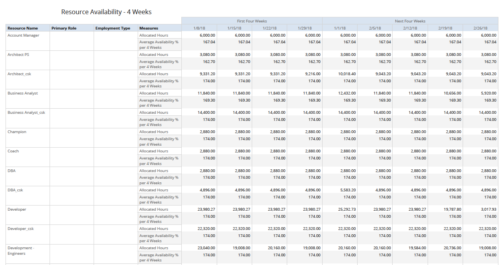 Resource Availability – 4 Weeks displays all resources with their total allocated hours by week, and an average availability percent (4 Wk Avail %) for next four weeks. This report also displays Resource Primary Role and Employment Type. User can further narrow their search by Resource Name, Resource Type & Week Start Date. User can use exact dates or relative dates for Week Start Date filter parameters.
 -
 The Timesheet Smoothing Process Workflow kicks-off when an individual timesheet is Submitted. It splits each transaction on the timesheet when total timesheet actuals exceed total weekly availability for the resource. Total weekly availability is determined by multiplying resource availability rate by the number of workdays in the week. Non-workdays include weekends, holidays, PTO, and other scheduled days off, as set on the resource calendar. If timesheet actuals <= total weekly availability, then the timesheet remains unchanged. But if timesheet actuals > total weekly availability, then the following occurs. Each timesheet transaction is reduced by a calculated percentage that will reduce the total regular hours to equal the total weekly availability. Then the remaining transaction hours are placed in a “Split” row for that task on that day, with an Input Type Code set based on a process parameter (which parameter can be set within the script action on the process). Note: If a single day has overtime hours, but the total timesheet actuals <= total weekly availability, no splitting occurs.
 -
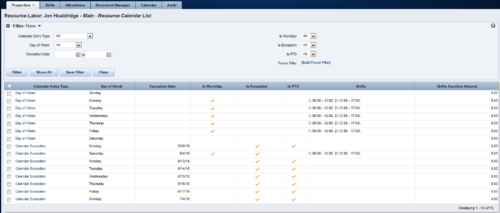 A Resource Calendar sub-object is populated by a non-object-specific process, executed by the “Execute a Process” job, which can be scheduled. The first 7 rows of the sub-object display the standard week from the base calendar, including columns for Day of Week, Is Workday (checked/unchecked), Shifts, and work Hours available. The remaining rows display calendar exceptions, including columns for Day of Week, Exception Date, Is Exception (checked), and work Hours available. If exception changes to a workday, Is Workday column is checked, and Shifts also display. If exception changes to a non-workday, Is PTO column is checked. Resource Calendar object is filterable by Calendar Entry Type (All, Calendar Exception, Day of Week), Day of Week, Exception Date Range, Is Workday, Is Exception, Is PTO, and power filter.
 -
 The Grant Resources Timesheet Edit Rights process will grant each resource timesheet edit instance rights to his or her own timesheets. This process will not remove any existing timesheet edit instance rights.
 -
 The Timesheet Approval - Auto process is an auto-start process that begins once the resource submits his or her timesheet. This process bypasses a Resource Manager approval and allows the user to post his or her timesheet. Once the timesheet is submitted, the process will lock the user’s timesheet to prevent editing. The process will then select the next action based on three different factors:
- The timesheet has less than 40 hours.
- The timesheet has 40 or more hours.
- The resource’s availability is less than 8hrs/day.
-
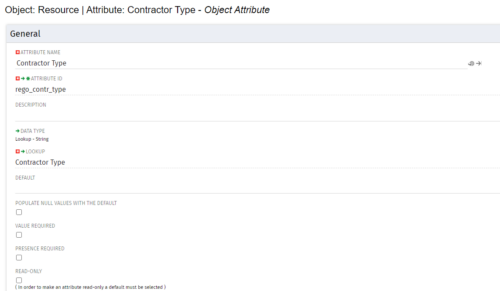
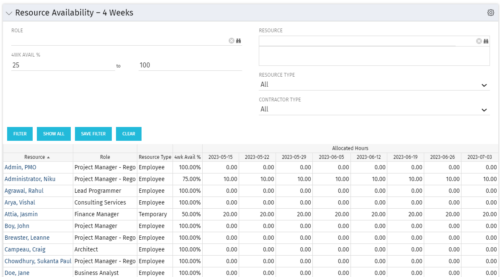 Resource Availability – 4 Weeks is a grid portlet that displays all resources with their total allocated hours by week, and an average availability percent (4 Wk Avail %) for next four weeks. If % Available is negative, this indicates an over-allocation. Zero% Average Availability indicates fully allocated (no remaining availability). Filterable by Role, Resource, Resource Type, Full-Time/Part-Time, Availability Range. Contractor Type is a custom attribute (Lookup - String) created on the Resource object. It is attached to the lookup, Contractor Type (Lookup ID: REGO_CONTRACTOR_TYPE) that has static values Part Time (PT) and Full Time(FT).
 -
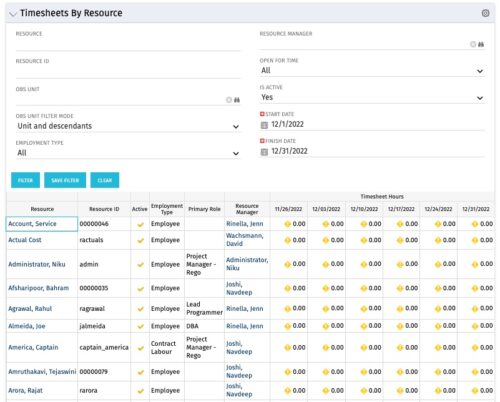 The Timesheets by Resource portlet gives the ability to highlight the time periods where resources are working overtime or working less than 25 hours a week. The filter requires timesheet Start Date and End Date to be provided. Additionally, the information can be filtered by Resource, Resource ID, OBS Unit, Employment Type, Resource Manager, Open for Time, and Active status. This portlet displays Resource, Resource ID, Active (yes/no), Employment Type, Primary Role, Resource Manager, and Timesheet Hours Flag. The flags are set with the logic
- Yellow = timesheets not posted / zero hour timesheets
- Green = where number of hours posted is > 25 and less than 45
- Red = where number of hours posted is < 25 or > 45
-
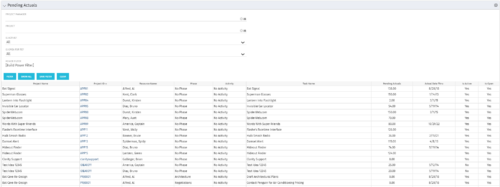 The Pending Actuals portlet displays pending actuals for resources by task. This portlet allows the user to filter on Project, Project Manager, Is Active and Is Open for Time Entry. This portlet provides Resource Managers and Project Managers a simple way to analyse which actuals have been submitted but not posted on specific tasks, as well as the aggregate pending hour total. Note: the information displayed is dependent on what the user has security rights to view.
 -
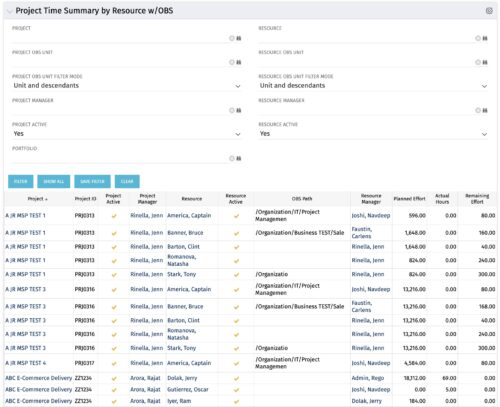 The purpose is to show actual hours, planned effort and remaining effort at the resource level, with the addition of OBS levels to support filtering and manipulation of the exported data.
 -
 The Time by Stage portlet displays time logged to each project task stage. The portlet displays the project id, project name, task stage, and charge code for each different task stage on the project. This portlet provides management with a quick view of all project task stages by project without having to navigate into each project individually.
 -
 The Time By Type - Pie Chart portlet is a graphical representation of time by type of investment for all resources the logged in user has security rights to view. This portlet pulls from the daily timeslices, and can be used for determining what types of projects receive the majority of hours. The filter option allows for entry of a specific start date and finish date.
 -
 This training document is a Rego Consulting Quick Reference Guide to assist with Entering and Submitting Time in Clarity’s Modern User Experience. This doc references version 16.1 views. Document includes Accessing & Selecting Timesheets, Populate Timesheet, Updating Timesheet, Submitting Timesheet and Entering Time for Someone Else.
 -
 This training document is a Rego Consulting Quick Reference Guide to assist resource managers with the approval of timesheets via the Review & Approve tab. This doc references version 16.1 views. Doc reviews accessing and selecting timesheets, reviewing submitted timesheets, approving timesheets, approving multiple timesheets, returning timesheets and the timesheet grid.
 -
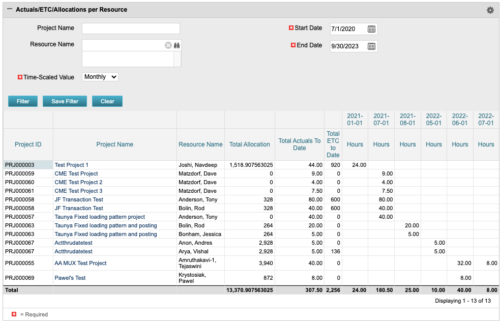 The portlet displays posted time by project for the logged in user based on time period and date range. This allows the user to see at a glance their ETC and actuals on the projects. The portlet displays the Total Allocation and Total Actuals to Date for the user on the projects they are allocated/assigned to. The actuals are displayed per month in the form of TSVs.
 -
 This portlet displays Actual Time by Project over a span of time. It supports Annual, Quarterly, Monthly, and Weekly time periods. The time span displayed is controlled by a filter field for the Start Date (of the time span) and by a filter field for the Number of Time Periods to be displayed. There are also filters for Project name, Project Manager, and Project Type.
 -
 This portlet pulls back the Availability and Allocation totals by Role between a user-specified Start and Finish Date, then the user can drilldown to look at the information for Applications. The Time Period filter allows for comparing these values across different timeframes (monthly, weekly, quarterly, annual) as desired. Other filters allow for looking at Active or Inactive Roles (or both) and including Active or Inactive Projects (or both) in the totals.
 -
 This training document is a Rego Consulting Quick Reference Guide to assist resource managers with the adjusting of timesheets. This doc references version 16.0.3 views. Document provides guidance on how to use the Review & Approve tab to adjust time that has already been entered by a resource.
 -
 This training document is a Rego Consulting Quick Reference Guide to assist resource managers with the approval of timesheets via the Review & Approve tab. This doc references version 16.0.2 views. Doc reviews accessing and selecting timesheets, reviewing submitted timesheets, approving timesheets, approving multiple timesheets, returning timesheets and the timesheet grid.
 -
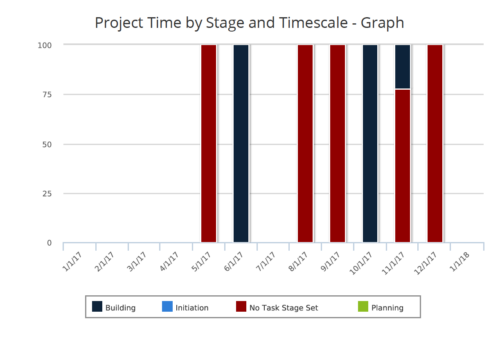 Time by Stage and Timescale – Graph report is a stacked column chart that displays hours for all tasks on projects by their stage for a user-defined time period. Using this report, Management can determine if excess time is being spent on a certain task stage within a project You can further narrow your search by Month Start Date, OBS Type & Path, Is Project Active? And Is Template?
 -
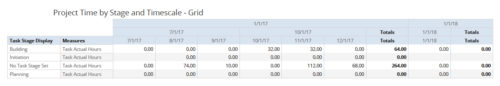 Time by Stage and Timescale – Grid report displays hours for all tasks on projects by their stage for a user-defined time period. Information can be drilled down to Year, Quarter or Monthly level. Using this report, Management can determine if excess time is being spent on a certain task stage within a project You can further narrow your search by Month Start Date, OBS Type & Path, Is Project Active? And Is Template?
 -
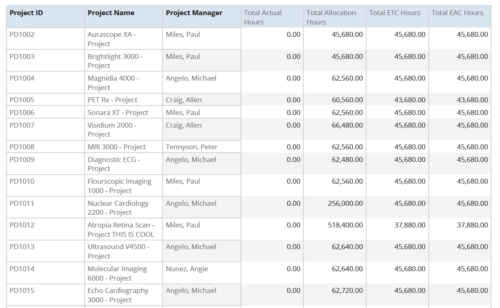 Project Time Summary report provides the project manager a single place to view Actual hours, Allocation hours, ETC hours and EAC hours for all filtered projects. It also displays Project ID, Project Name and Project Manager. User can further narrow their search by OBS Type & Path, Project Name, Project ID, Project Manager, Task Name, Project Status, Project Stage, Project Role, Is Active? and Is Template?.
 -
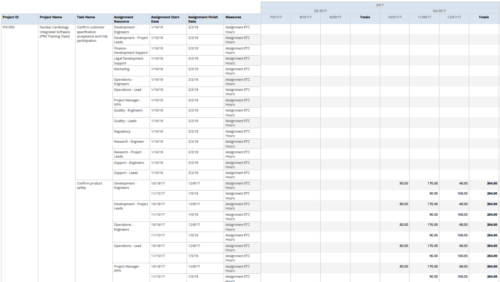 Assignments by Task Over Time report display all assignments by task for all resources. Information can be drilled down to yearly, quarterly or monthly level. This report helps in determining the tasks a user is assigned to or how many hours a user is assigned to a task. You can further narrow your search by OBS Type & Path, Project ID, Project Name, Task Name, Assignment Resource, Is project Active?, Is Template? And Month End date.
 -
The Timesheet Smoothing Process Workflow kicks-off when an individual timesheet is Submitted. It splits each transaction on the timesheet when total timesheet actuals exceed total weekly availability for the resource. Total weekly availability is determined by multiplying resource availability rate by the number of workdays in the week. Non-workdays include weekends, holidays, PTO, and other scheduled days off, as set on the resource calendar. If timesheet actuals <= total weekly availability, then the timesheet remains unchanged. But if timesheet actuals > total weekly availability, then the following occurs. Each timesheet transaction is reduced by a calculated percentage that will reduce the total regular hours to equal the total weekly availability. Then the remaining transaction hours are placed in a “Split” row for that task on that day, with an Input Type Code set based on a process parameter (which parameter can be set within the script action on the process). Note: If a single day has overtime hours, but the total timesheet actuals <= total weekly availability, no splitting occurs.
-
 The process is built to clear the random timesheet locks that happens occasionally. There are three Processes and one lookup component and one job definition in the package.
- PRLock (Timesheets) Record Removal (ID: rego_prlock_rec_rmvl). This process requires PRNAME, PRTABLENAME and PRRECORDID from PRLock Table.
- The Lookup PRLock Check (Timesheet) (Id: REGO_PRLOCK_CHECK) should be used to update the GEL parameters for the above process.
- PRLock (Timesheets) Record Removal All (ID: rego_prlk_rc_rmv_all) This deletes ALL prtimesheet locks.
- Rego Remove Timesheet Locks (ID: rego_rmv_ts_locks). This process is run as a job “PrLock Clear for Timesheet Locks” which performs the same functionality as the above two processes. The process and job definition are separate XOG files.
- PRLock (Timesheets) Record Removal (ID: rego_prlock_rec_rmvl). This process requires PRNAME, PRTABLENAME and PRRECORDID from PRLock Table.
-
The process is built to clear the random timesheet locks that happens occasionally. There are three Processes and one lookup component and one job definition in the package.
- PRLock (Timesheets) Record Removal (ID: rego_prlock_rec_rmvl). This process requires PRNAME, PRTABLENAME and PRRECORDID from PRLock Table.
- The Lookup PRLock Check (Timesheet) (Id: REGO_PRLOCK_CHECK) should be used to update the GEL parameters for the above process.
- PRLock (Timesheets) Record Removal All (ID: rego_prlk_rc_rmv_all) This deletes ALL prtimesheet locks.
- Rego Remove Timesheet Locks (ID: rego_rmv_ts_locks). This process is run as a job “PrLock Clear for Timesheet Locks” which performs the same functionality as the above two processes. The process and job definition are separate XOG files.
- PRLock (Timesheets) Record Removal (ID: rego_prlock_rec_rmvl). This process requires PRNAME, PRTABLENAME and PRRECORDID from PRLock Table.
-
A Resource Calendar sub-object is populated by a non-object-specific process, executed by the “Execute a Process” job, which can be scheduled. The first 7 rows of the sub-object display the standard week from the base calendar, including columns for Day of Week, Is Workday (checked/unchecked), Shifts, and work Hours available. The remaining rows display calendar exceptions, including columns for Day of Week, Exception Date, Is Exception (checked), and work Hours available. If exception changes to a workday, Is Workday column is checked, and Shifts also display. If exception changes to a non-workday, Is PTO column is checked. Resource Calendar object is filterable by Calendar Entry Type (All, Calendar Exception, Day of Week), Day of Week, Exception Date Range, Is Workday, Is Exception, Is PTO, and power filter.
-
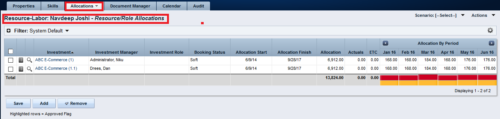
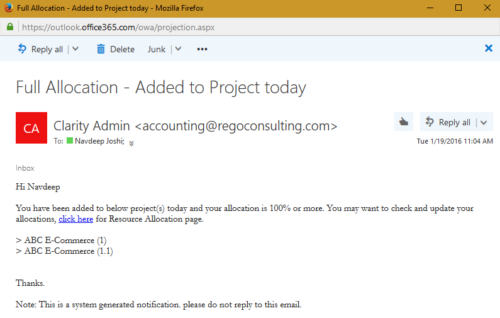 The process notifies resource who has been added to investment today and allocation is greater or equal to 100%. The process is on-demand and would require the user to have appropriate rights to run the process. Process should be scheduled as daily once job.
 -
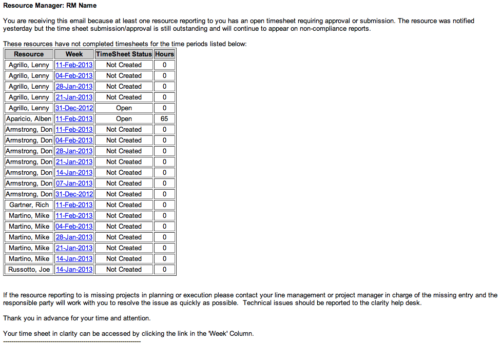 The Time Tracking Stalker - RM workflow process automatically sends an email to Resource Managers for each one of their resources that have not submitted their timesheet for a prior open time period, thus informing the RM if their resources are submitting their timesheets on time. Project Managers will also benefit since the notifications will help to ensure that time is being posted against their projects in a timely manner, helping to provide them with an accurate view of time expended on the projects.
 -
 Are you on an older version of CA PPM? Do you want to understand the value of the new features and functions in recent versions? Have you seen the new UX and do you wonder when is the right time to move over? This class is a demonstration of the new UX, new features in both classic and new UX, and the value of these features for customers.


Copyright 2023 • Rego Consulting Corporation • Privacy Policy