-
 This session will align you with best practices for using Clarity's resource management functionality. Come and learn about the OOTB capabilities for resource insights like allocations, assignments, availability, and more. Additionally, tips and tricks will be shared, providing you with a toolkit of ideas for your organization!
 -

A presentation slide deck from Rego University 2022. This document reviews the best practices for resource management in Clarity. - Implementation
- Availability
- Allocation
- Assignment
- Reporting
- Notification
- Data Maintenance
-
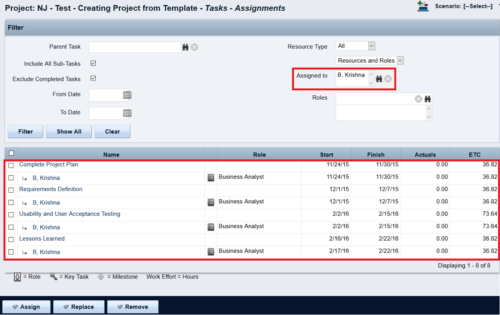
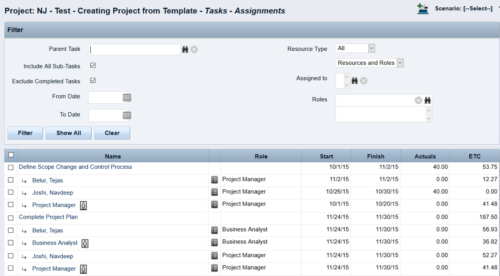 This Tech Trick walks you through the steps in CA PPM to make Bulk Role replacements on tasks. Useful when you want to make the changes to the project template which has a large WBS structure, and a lot of role assignments to tasks.
 -
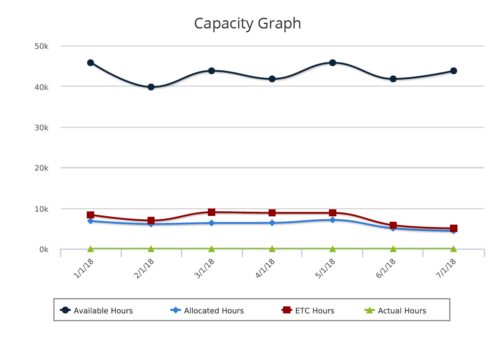
 The Capacity Graph - Investment portlet displays Availability, Allocations, Assignments and Actuals for active resources in a single project. This portlet pulls from timeslices and allows the user to filter on weekly, monthly, or quarterly data. This portlet provides a Project Manager with a simple way to analyse: Allocations vs. Actuals and Allocations vs. ETC. Depending on metric goals, the graph allows the user to determine where areas of improvement may exist.
 -
The Capacity Graph - Investment portlet displays Availability, Allocations, Assignments and Actuals for active resources in a single project. This portlet pulls from timeslices and allows the user to filter on weekly, monthly, or quarterly data. This portlet provides a Project Manager with a simple way to analyse: Allocations vs. Actuals and Allocations vs. ETC. Depending on metric goals, the graph allows the user to determine where areas of improvement may exist.
-

 The Capacity Graph portlet displays Availability, Allocations, Actuals and Assignments for one or more active resource(s) in a single view. This portlet pulls data from timeslices, and allows the user to filter on a weekly, monthly or quarterly data. The Estimated Time to Complete (ETC) and Allocation data will only show for projects that are active. This portlet provides Resource Managers, PMOs and Executives with a simple way to analyse: Allocations vs. Availability, Allocations vs. Actuals, Allocations vs. ETC and ETC vs. Availability. The graph allows the user to determine where areas of improvement may exist and quickly identify potential areas of constraint. Note: the information displayed is dependent on what the user has security rights to view.
 -
The Capacity Graph portlet displays Availability, Allocations, Actuals and Assignments for one or more active resource(s) in a single view. This portlet pulls data from timeslices, and allows the user to filter on a weekly, monthly or quarterly data. The Estimated Time to Complete (ETC) and Allocation data will only show for projects that are active. This portlet provides Resource Managers, PMOs and Executives with a simple way to analyse: Allocations vs. Availability, Allocations vs. Actuals, Allocations vs. ETC and ETC vs. Availability. The graph allows the user to determine where areas of improvement may exist and quickly identify potential areas of constraint. Note: the information displayed is dependent on what the user has security rights to view.
-
 Capacity Graph report provides the Resource Managers & PMO a single place to view Monthly Availability, Allocations, Actuals and Assignments for one or more active resources. Information is displayed in the form of a line chart. Legend displays the color associated with each metric. Mouse over the line chart displays hours associated with that corresponding metric. This report provides Managers a simple means to analyze: Allocations vs. Availability, Allocations vs. Actuals, Allocations vs. ETC and ETC vs. Availability and helps in determining the areas of improvement. User can further narrow their search by OBS Type & Path, Month Start Date, Resource Name, Resource Manager, Primary Role & Employment Type.
 -
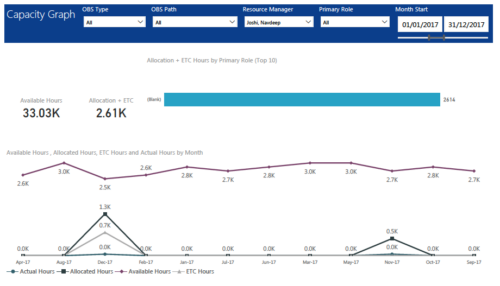 Capacity Graph report displays Availability, Allocations, Actuals and Assignments for one or more active resource(s) in a single view. Report contains the following components: KPIs: Displays Available hours, Allocation + ETC for filtered criteria. Bar graph: Displays Allocation + ETC by primary role Line chart: Displays Availability, Allocations, Actuals and Assignments by time period. This portlet provides Resource Managers, PMOs and Executives with a simple way to analyze: Allocations vs. Availability, Allocations vs. Actuals, Allocations vs. ETC and ETC vs. Availability. User can further narrow their search by OBS Type & Path, Resource Manager, Primary Role, Start and End Date.
 -
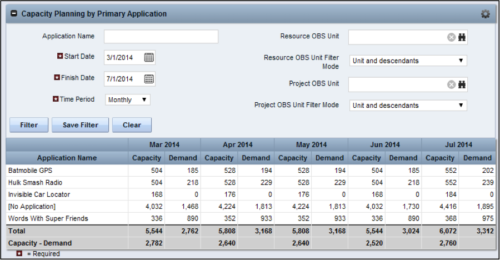 The Capacity Planning by Primary Application portlet displays the capacity and demand by primary application for a selected timeframe. This portlet is used to determine which applications are in high demand, being used efficiently, and how much capacity may be remaining for the time period. The portlet may be filtered by application name, resource OBS or project OBS to narrow the results. The timeframe can be set to display daily, weekly, monthly, quarterly, or annually.
 -
The Capacity Planning by Primary Application portlet displays the capacity and demand by primary application for a selected timeframe. This portlet is used to determine which applications are in high demand, being used efficiently, and how much capacity may be remaining for the time period. The portlet may be filtered by application name, resource OBS or project OBS to narrow the results. The timeframe can be set to display daily, weekly, monthly, quarterly, or annually.
-
 This portlet pulls back the Availability and Allocation totals by Role between a user-specified Start and Finish Date, then the user can drilldown to look at the information for Applications. The Time Period filter allows for comparing these values across different timeframes (monthly, weekly, quarterly, annual) as desired. Other filters allow for looking at Active or Inactive Roles (or both) and including Active or Inactive Projects (or both) in the totals.
 -
This portlet pulls back the Availability and Allocation totals by Role between a user-specified Start and Finish Date, then the user can drilldown to look at the information for Applications. The Time Period filter allows for comparing these values across different timeframes (monthly, weekly, quarterly, annual) as desired. Other filters allow for looking at Active or Inactive Roles (or both) and including Active or Inactive Projects (or both) in the totals.
-
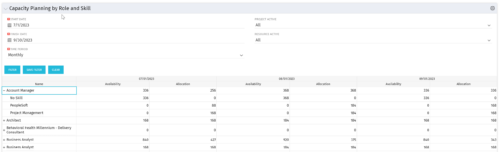 The Capacity Planning by Role and Skill portlet displays all availability and demand in the system summarized by role. The portlet also allows the user to drill-down further into the role and separate the hours by primary skill. This portlet leverages the timeslices, and pulls availability from resources and allocation from the team records. The user is able to narrow the results by filtering on start/finish date, time period, active projects, and active resources. Using this portlet, a resource manager can quickly determine resource needs, skill needs, and overall allocation/availability of roles.
 -
The Capacity Planning by Role and Skill portlet displays all availability and demand in the system summarized by role. The portlet also allows the user to drill-down further into the role and separate the hours by primary skill. This portlet leverages the timeslices, and pulls availability from resources and allocation from the team records. The user is able to narrow the results by filtering on start/finish date, time period, active projects, and active resources. Using this portlet, a resource manager can quickly determine resource needs, skill needs, and overall allocation/availability of roles.
-
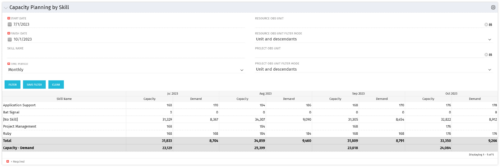 The Capacity Planning by Skill portlet displays the capacity and demand by skill for a selected timeframe. This portlet is used to determine which skills are in high demand, being used efficiently, and how much capacity may be remaining for the time period. The portlet may be filtered by skill name, resource OBS or project OBS to narrow the results.
 -
The Capacity Planning by Skill portlet displays the capacity and demand by skill for a selected timeframe. This portlet is used to determine which skills are in high demand, being used efficiently, and how much capacity may be remaining for the time period. The portlet may be filtered by skill name, resource OBS or project OBS to narrow the results.
-
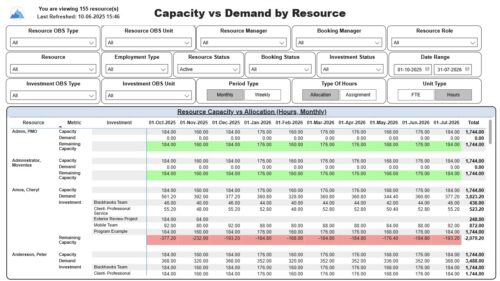 The Capacity vs. Demand by Resource report displays resource capacity and demand at the resource level across investments. The report gives you visibility into the capacity, demand, and remaining capacity by resource. The report displays amounts by week or month, and in total. The amounts might be displayed as hours or FTEs. Report Prerequisites: Verify that you have completed the following prerequisites before you run this report: • The Load Data Warehouse job must be run before you run this report. If the Data Warehouse is not populated, the report will not display any data. Also, most of the report parameters do not display options. • Resource demand allocation amounts display if the resource is allocated to at least one investment and the report display type of hours as allocations. Resource demand assignment amounts display if the resource is assigned to at least one task on the investment and the report displays type of hours as assignments.
 -
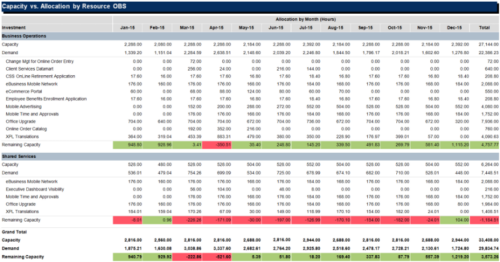
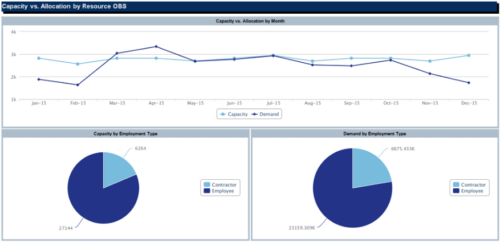 The Capacity vs Allocation by OBS report is a transaction based Jaspersoft report that does not require the Load Jaspersoft Datawarehouse job to be run. The report will pull real-time data from the transaction tables in Clarity. This report can be run from either the Advanced Reporting or Reports and Jobs area within Clarity. The Capacity vs. Allocation by OBS report displays resource capacity and demand across investments. The report can be grouped by any OBS level, providing visibility into resources at any level of the organization. The report displays amounts by week or month, and in total. The amounts can be displayed as hours or FTEs.
 -
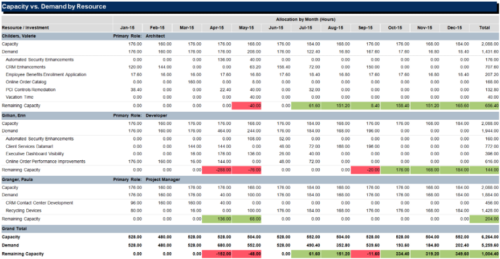 The Capacity vs Demand by Resource report is a transaction based Jaspersoft report that does not require the Load Jaspersoft Datawarehouse job to be run. The report will pull real-time data from the transaction tables in Clarity. This report can be run from either the Advanced Reporting or Reports and Jobs area within Clarity. The Capacity vs. Demand by Resource report displays resource capacity and demand at the resource level across investments. The report gives you visibility into the capacity, demand, and remaining capacity by resource. The report displays amounts by week or month, and in total. The amounts might be displayed as hours or FTEs.
 -
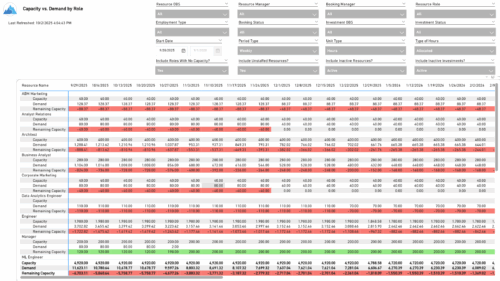 The Capacity vs. Demand by Role report provides visibility into resource utilization by comparing available capacity to actual demand across investments at the role level. It highlights capacity, demand, and remaining capacity, helping identify potential surpluses or shortfalls. Data can be viewed by week or month and displayed in either hours or full-time equivalents (FTEs) to support detailed workforce planning and analysis.
 -
 No matter how hard we try, many organizations cannot pry Excel out of the hands of project and resource managers. In this class we will explore possibilities that give up the battle and embrace Excel as a great data entry tool. We will show some neat case studies on quick Excel integrations deployed at customers.
 -

 A presentation slide deck from Rego University 2022. Presentations by Erie Insurance, University of California, San Francisco, and The Hershey Company.
 -
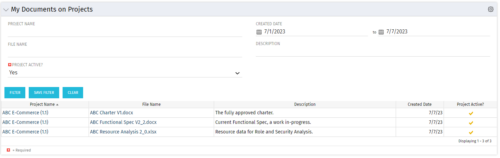 This Portlet allows users to quickly access Documents they uploaded into Projects via the Classic UI à Collaboration tab or via the New UX Documents module. Clicking on the File Name downloads the file, clicking on the Options gear allows users to export the list to Excel.
 -
A process creating a new Cost Plan. Cost Plan properties:
Pre-conditions:Name Cost Plan created on: yyyy/mm/dd hh:mm:ss Grouping attributes Charge Code, Transaction Type Start Period The earliest fiscal period with Actuals (from PPA_WIP table) or current period, if there are no actuals Finish Period The latest fiscal period with a non-zero allocation (from PRJ_BLB_SLICES table, SLICE_REQUEST_ID = 6 Period Type Monthly Plan of Record True Planned Cost For periods in the past – from Actuals (Charge Code, Transaction Type, Quantity (Units), Cost (Amount) taken from Transactions (PPA_WIP & PPA_WIP_DETAILS); For current and future periods – from Allocations (Charge Code taken from the Project, Transaction Class from the Resource, Quantity from allocation slices, Cost from the Rate Matrix (NBI_PROJ_RES_RATES_AND_COSTS table) - the Project must be financially enabled.
- if a new Team Member is added, Rate Matrix job must be run, so the rates are populated in the NBI table.
- if the Allocation changes, allow the timeslice job to finish before running the process.
- the Project should have the Charge Code set.
-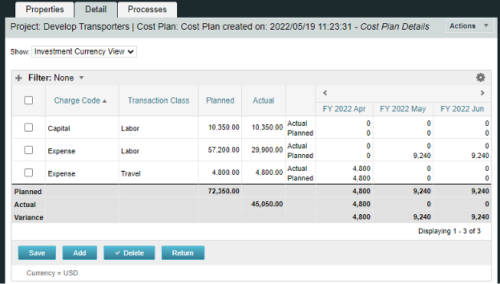
 This training document is a Rego Consulting Quick Reference Guide to assist with creating and management of a project team in Clarity’s Modern User Experience. The document reviews accessing teams, creating a team, allocating a team on an investment, as well as additional team related information.
 -
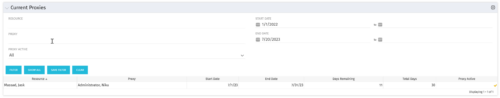 The Current Proxies portlet provides a user with an overview of all the resources in the system currently using a proxy. This portlet is helpful to determine a proxy if a user is currently out of the office. The portlet provides several pieces of information related to the resource including: resource names, proxy, start date, end date, days remaining, total days, and if the proxy is active. The user may filter by resource name, proxy name, proxy status (defaults to Yes), and start/end dates (defaults to the current date).


Copyright 2023 • Rego Consulting Corporation • Privacy Policy