-
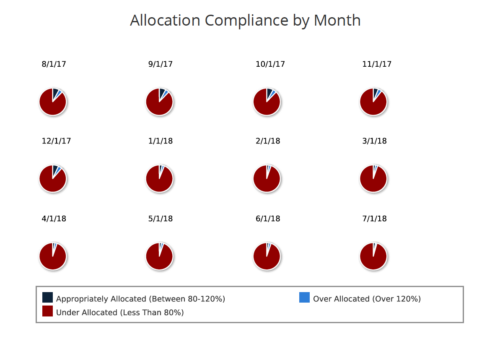 Allocation Compliance Pie Chart provides the resource manager a single place to view the Monthly Resource Allocation compliance for all resources in the form of a Pie chart. A separate Pie chart is displayed for each month. Allocation Compliance is calculated based on the value of 'Availability to Allocation Hours %'. Allocation Compliance is 'Under Allocated (Less Than 80%)' WHEN 'Availability to Allocation Hours %’ is less than 80. Allocation Compliance is 'Appropriately Allocated (Between 80-120%)' WHEN 'Availability to Allocation Hours %' is between 80 and 120. Allocation Compliance is 'Over Allocated (Over 120%)' WHEN 'Availability to Allocation Hours %' is greater than 120. User can further narrow their search by Resource Is Active? , OBS Type, OBS Path and Month Start Date. User can use exact dates or relative dates for Month Start Date filter parameter.
 -
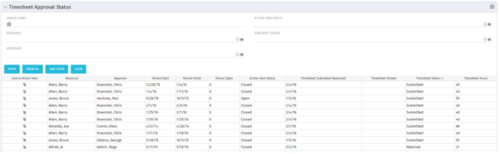 Portlet to show the stage of any Action Item triggered by Timesheet submission. Portlet allows for a period start date input, filters by Resource, Approver, Action Item Status and Timesheet Status. A link to the action item is provided for direct action by review if needed. This portlet is only for the clients who have established a process that triggers on Timesheet Status change to Submitted and to send Action Items to the person responsible for timesheet approval/validation i.e. PM for project tracking and/or RM for overall approval of the timesheet. The portlet won’t display any data if there are no timesheet Action Items. Examples of such processes would be CA’s OOTB Project Manager Approval or the Timesheet Approval - PM and RM process found on RegoXchange.
 -
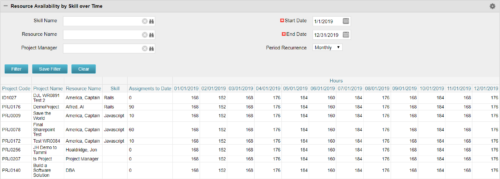 Resource Availability by Skill over Time is a grid portlet that provides Resource Managers a single place to view Resources’ skill sets along with their availability (hrs.) over a period of time. This report also displays the assigned Investments to date and the Actual hours to date for the Resource on those respective Investments. Users can further narrow their search by Skill Name, Resource Name, Project Manager, Start Date, End Date and Period Recurrence.
 -
 This training document is a Rego Consulting Quick Reference Guide to assist with General Navigation in Clarity’s Modern User Experience. This doc references version 16.0.3 views. Doc reviews the Menu Bar and User Tool Bar.
 -
 This training document is a Rego Consulting Quick Reference Guide to assist with General Navigation in Clarity’s Modern User Experience. This doc references version 16.0.2 views. Doc reviews the Menu Bar and User Tool Bar.
 -
 A Quick Reference Guide to assist in the staffing of a resource team in Clarity’s Classic UI, utilizing the Phoenix Theme. Reviews accessing the project and assigning the team.
 -
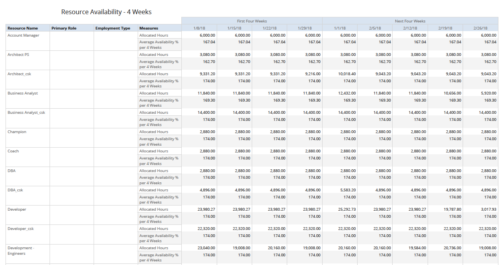 Resource Availability – 4 Weeks displays all resources with their total allocated hours by week, and an average availability percent (4 Wk Avail %) for next four weeks. This report also displays Resource Primary Role and Employment Type. User can further narrow their search by Resource Name, Resource Type & Week Start Date. User can use exact dates or relative dates for Week Start Date filter parameters.
 -
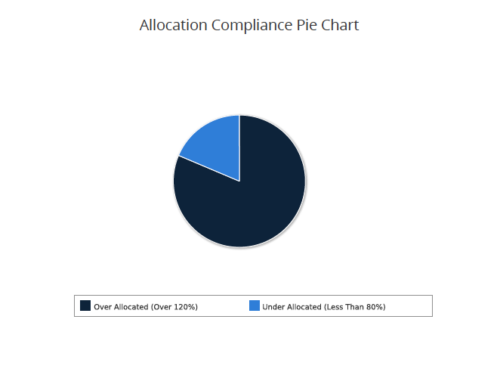 Allocation Compliance Pie Chart provides the resource manager a single place to view the Allocation compliance information in the form of a Pie chart. Allocation Compliance is calculated based on the value of 'Availability to Allocation Hours %'. Allocation Compliance is 'Under Allocated (Less Than 80%)' WHEN 'Availability to Allocation Hours %’ is less than 80. Allocation Compliance is 'Appropriately Allocated (Between 80-120%)' WHEN 'Availability to Allocation Hours %' is between 80 and 120. Allocation Compliance is 'Over Allocated (Over 120%)' WHEN 'Availability to Allocation Hours %' is greater than 120. User can further narrow their search by Resource Is Active?, OBS Type, OBS Path, Allocation Start Date, Investment Name and Resource Manager. User can use exact dates or relative dates for Allocation Start Date filter parameter.
 -
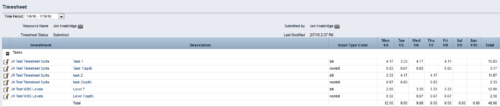
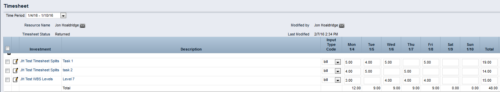 The Timesheet Smoothing Process Workflow kicks-off when an individual timesheet is Submitted. It splits each transaction on the timesheet when total timesheet actuals exceed total weekly availability for the resource. Total weekly availability is determined by multiplying resource availability rate by the number of workdays in the week. Non-workdays include weekends, holidays, PTO, and other scheduled days off, as set on the resource calendar. If timesheet actuals <= total weekly availability, then the timesheet remains unchanged. But if timesheet actuals > total weekly availability, then the following occurs. Each timesheet transaction is reduced by a calculated percentage that will reduce the total regular hours to equal the total weekly availability. Then the remaining transaction hours are placed in a “Split” row for that task on that day, with an Input Type Code set based on a process parameter (which parameter can be set within the script action on the process). Note: If a single day has overtime hours, but the total timesheet actuals <= total weekly availability, no splitting occurs.
 -
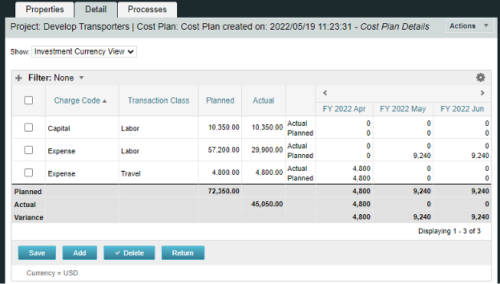
A process creating a new Cost Plan. Cost Plan properties:
Pre-conditions:Name Cost Plan created on: yyyy/mm/dd hh:mm:ss Grouping attributes Charge Code, Transaction Type Start Period The earliest fiscal period with Actuals (from PPA_WIP table) or current period, if there are no actuals Finish Period The latest fiscal period with a non-zero allocation (from PRJ_BLB_SLICES table, SLICE_REQUEST_ID = 6 Period Type Monthly Plan of Record True Planned Cost For periods in the past – from Actuals (Charge Code, Transaction Type, Quantity (Units), Cost (Amount) taken from Transactions (PPA_WIP & PPA_WIP_DETAILS); For current and future periods – from Allocations (Charge Code taken from the Project, Transaction Class from the Resource, Quantity from allocation slices, Cost from the Rate Matrix (NBI_PROJ_RES_RATES_AND_COSTS table) - the Project must be financially enabled.
- if a new Team Member is added, Rate Matrix job must be run, so the rates are populated in the NBI table.
- if the Allocation changes, allow the timeslice job to finish before running the process.
- the Project should have the Charge Code set.
-
 The interface runs using a MS Excel template called Project Allocation Upload that will be distributed to users.
- Configuration
- A master object called Allocation Upload Files will be created. The object will contain a required attachment field on the create page that will receive the Project Allocation Upload MS Excel file.
- A new sub-object called Allocation Upload Records will be created. This object will contain the fields necessary to receive the data rows from the Project Allocation Upload template.
- The master object will store the file level data while the sub-object will store the rows that belong to the file.
- Users must be granted security to view and edit the master and sub-objects in order to run the upload process.
- Project Allocation Upload Template
- The Project Allocation Upload template must remain static. Any changes other than creating additional time periods or additional rows will cause the process to error.
- Only the Project Allocation Upload template can be used to load records to the new objects.
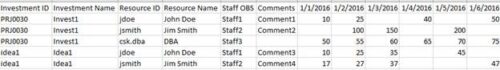
- The Project Allocation Upload will only accept months across the x-axis in the format DD/MM/YYYY. The month headers must appear in the first row of the template and contain the first day of the month.
- The template must be distributed to the users that will be using the upload functionality.
- Users will be required to enter an Investment ID and Resource ID so the process can correctly identify investments and resources to upload the allocation hours against.
- A Staff OBS is not required but can be populated by users to have the data uploaded into CA PPM.
- The owner of the Project Allocation Upload template is responsible for providing users a valid list of Staff OBS Units.
- Investments will not be created through the interface. As such a valid Investment ID must be provided.
- Resources can be added to the investment team through the interface. If a valid Resource ID is provided the resource’s allocation will be updated if the resource already exists on the investment. If the resource does not already exist on the investment the resource will be added to the team along with the allocation hours.
- The Project Allocation Upload template will accept hours, not allocation percentages. Because CA PPM stores allocations as percentages of a resource’s availability the upload process must convert hours to a percentage. As a result small rounding errors may occur in the neighborhood of .01 hours per month.
- Resources cannot be removed from investment teams through the interface.
- The Project Allocation Upload template will support allocation uploads to different instances of the same role on the same investment as long as different Staff OBS units are provided.
- If multiple instances of the same role are assigned to the investment with the same Staff OBS the process will not know which instance of the role to upload the hours to. In these cases the process will consider these records as invalid. The PM will need to manually remove one of the instances or upload the hours manually..
- If multiple instances of the same role with the same Staff OBS unit are assigned to the same investment in the upload template the monthly hours will be totaled by investment, by role, by Staff OBS.
- The allocation template will follow the format in the screenshot area.
- Process
- To initiate the Allocation Interface a user will create a new Allocation Upload File instance, attach the Project Allocation Upload Template, and save the record. The file attachment field is an “enter-once” field, meaning that once a value has been set it cannot be changed. If a user wishes to upload another field they will create a new record.
- After the file has been attached the user will be presented with two check box fields, one to Validate and one to Validate and Upload. Checking either or both options will initiate the process.
- The process will first determine if any sub-object instances exist for the file. In other words, do any records already exist in the Allocation Upload Records sub-object pertaining to the newly uploaded file. If there are no records in the sub-object the process will use the uploaded file and read its contents into the sub-object. If errors are encountered during the file read they will be written to the process console, the process will throw an error, and end.
- Next, records will be validated. Only the sub-object instances that belong to the master object will be validated. Records belonging to other master object instances will not be validated or processed. All records in a status of Ready for Processing, Failed Validation, or Xog Load Error will be validated. Records will fail validation if an investment is not found corresponding to the investment ID provided, a resource is not found corresponding to the resource ID provided, or the date provided is not valid, or a provided Staff OBS does not yield a match. Records that fail validation will be flagged as invalid along with a description as to why they failed validation. Records that pass validation will be flagged as Ready for Processing and locked. The sub-object instances can be exported to excel if further analysis is required. If the Validate & Upload option was not selected the process will end here.
- Regarding the Staff OBS. Only one OBS can be designed as the OBS that the interface will use to validate the Staff OBS records.
- The Staff OBS value from the template must match against the name of an OBS node in the designed Staff OBS.
- If the Staff OBS value matches against multiple nodes in the Staff OBS the record will be flagged as invalid as the process will not know which node to use.
- If the Validate & Upload option was selected the process will continue and any valid records will be xog’ed into the investment team. The xog will be executed as the user that initiated the process so any security rules enforced by xog will be respected by the process.
- Successful records will be flagged as Processed Successfully in the sub-object and remain locked. Records that did not load successfully, due to a xog error or security limitation will be flagged as Xog Load Error, unlocked, and updated with a description containing the full xog output.
- Records that failed validation or failed the xog load can be manually edited and revalidated, and attempt to be uploaded again. Subsequent runs of the process will not read in data from the file, but rather process only sub-object instances that currently exist.
- Configuration
-
 This process must be run using the “Execute a Process” job. Job may be scheduled or run on-demand. Process pulls Availability Rate from the Availability blob for each resource, where blob is not null. Then it populates this value into a custom Daily Availability attribute (Number field with 2 decimals) on the Resource object. This field does not have to be displayed to be used for reporting. Because the OOB Availability Rate field is stored only in a blob, it is difficult to include in portlet or report output. The use of this custom attribute makes the value easily reportable.
 -
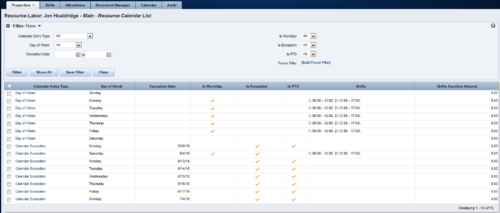 A Resource Calendar sub-object is populated by a non-object-specific process, executed by the “Execute a Process” job, which can be scheduled. The first 7 rows of the sub-object display the standard week from the base calendar, including columns for Day of Week, Is Workday (checked/unchecked), Shifts, and work Hours available. The remaining rows display calendar exceptions, including columns for Day of Week, Exception Date, Is Exception (checked), and work Hours available. If exception changes to a workday, Is Workday column is checked, and Shifts also display. If exception changes to a non-workday, Is PTO column is checked. Resource Calendar object is filterable by Calendar Entry Type (All, Calendar Exception, Day of Week), Day of Week, Exception Date Range, Is Workday, Is Exception, Is PTO, and power filter.
 -
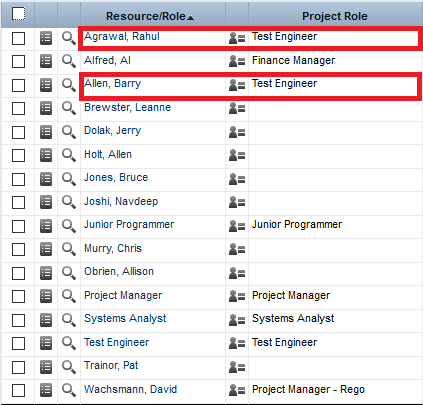
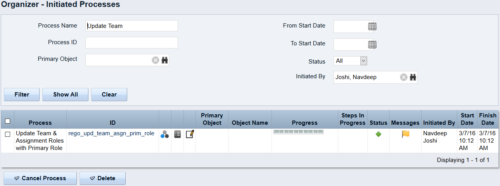 This process updates the team, assignment and timesheet roles with the primary role where they do not match. This way, the PM can push all roles to team and assignment for that project before they do a cost plan.
 -
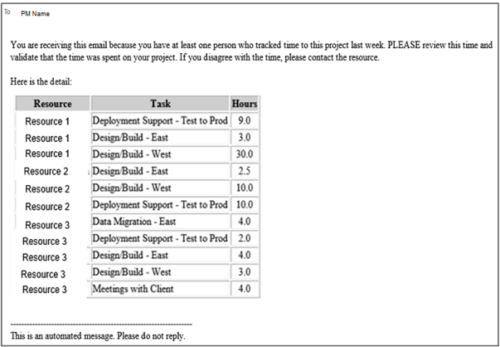 This process pulls in the total hours tracked, by resource, by task, for a given project for the weekly time period that ended. The information is sent to the Project Manager listed on the project. This process can be scheduled via the Execute a Process job.
 -
 The Timesheet Approval - RM and PM process is an auto-start process that begins once the resource submits his or her timesheet. This process provides a checks-and-balances style to ensure that all resources entering time have entered the 40 hours. Once the timesheet is submitted, the process will lock the user’s timesheet to prevent editing. The process will then select the next action based on three different factors:
- The timesheet has less than 40 hours.
- The timesheet has 40 or more hours.
- The resource’s availability is less than 8hrs/day.
-
 No matter how hard we try, many organizations cannot pry Excel out of the hands of project and resource managers. In this class we will explore possibilities that give up the battle and embrace Excel as a great data entry tool. We will show some neat case studies on quick Excel integrations deployed at customers.
 -

This portlet displays the monthly allocation per resource. The PM can view by the RM or the resource to get the data for monthly resource allocations. The table below describes the available filter fields in the portlet. Column Label Description Work Effort Manager Manager of the Investment the Work Effort is on Work Effort Active Active status of the Investment the Work Effort is on Resource Resource’s Name Internal Resource ID Resource’s ID Zero Allocation Show Allocations that equal zero Open for Time Entry Is the Resource Open for Time Entry Resource Active Resource’s Active status Role Resource’s Primary Role OBS Unit Resource’s OBS Start Allocation Start Time to filter by End Allocation Finish time to filter by -
 This Portlet produces a Grid View of Resources using total Resource Allocation from each Project’s Team / Staff, per month; output is expressed as a %. Users can specify which Resource OBS to use as a Filter (unit and descendants is assumed) as well as a Start/End Date.
 -
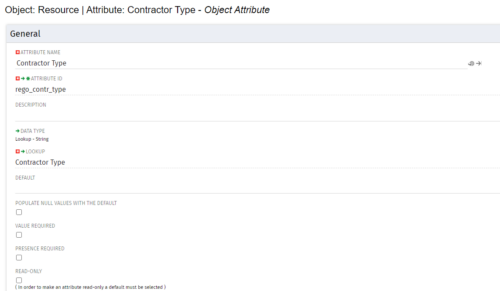
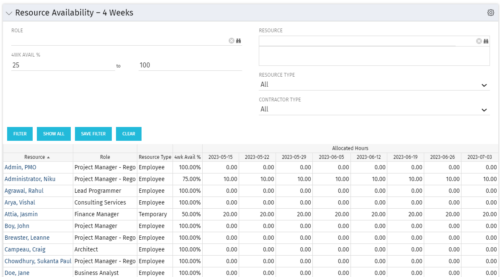 Resource Availability – 4 Weeks is a grid portlet that displays all resources with their total allocated hours by week, and an average availability percent (4 Wk Avail %) for next four weeks. If % Available is negative, this indicates an over-allocation. Zero% Average Availability indicates fully allocated (no remaining availability). Filterable by Role, Resource, Resource Type, Full-Time/Part-Time, Availability Range. Contractor Type is a custom attribute (Lookup - String) created on the Resource object. It is attached to the lookup, Contractor Type (Lookup ID: REGO_CONTRACTOR_TYPE) that has static values Part Time (PT) and Full Time(FT).
 -
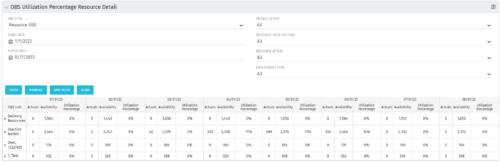
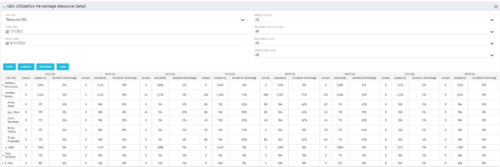 This portlet depicts the Resource Utilization by comparing actual hours booked as a percentage of total resource availability grouped and totaled by OBS Unit in a hierarchical fashion. Resource availability is determined by the working days and daily availability on the individual Resource Calendar and is depicted on a Monthly basis. This portlet uses Monthly Times and the Time Slice job may need to run before the end user will see results in the portlet. The portlet filters for Project Activity, Resource Open for Time, Resource Activity, and Employment time have been added to OBS Type and the Start and Finish dates. The OBS summary totals show on a single line, but can be clicked (+) to roll out the details behind each OBS total.
 -
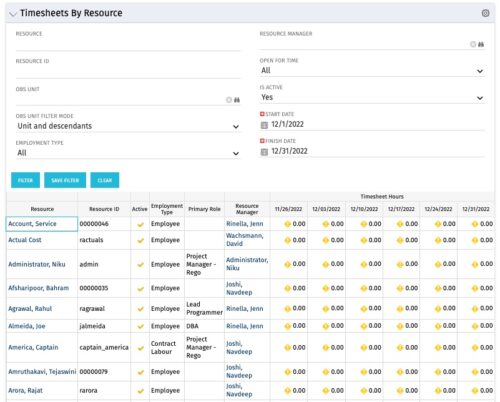 The Timesheets by Resource portlet gives the ability to highlight the time periods where resources are working overtime or working less than 25 hours a week. The filter requires timesheet Start Date and End Date to be provided. Additionally, the information can be filtered by Resource, Resource ID, OBS Unit, Employment Type, Resource Manager, Open for Time, and Active status. This portlet displays Resource, Resource ID, Active (yes/no), Employment Type, Primary Role, Resource Manager, and Timesheet Hours Flag. The flags are set with the logic
- Yellow = timesheets not posted / zero hour timesheets
- Green = where number of hours posted is > 25 and less than 45
- Red = where number of hours posted is < 25 or > 45
-
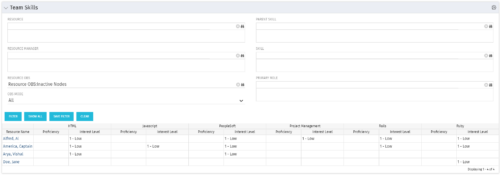 The Team Skills portlet displays Skill Proficiency and Interest Level by Resource. Users can utilize this view to search for Resources by Skill, Parent Skill, Interest, Role, Parent Role, Resource and Resource OBS. This portlet grants a Project Manager or Resource Manager the ability to determine which Resources best fit the needs for their project.
 -
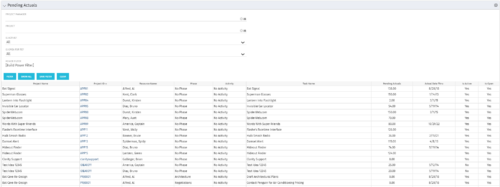 The Pending Actuals portlet displays pending actuals for resources by task. This portlet allows the user to filter on Project, Project Manager, Is Active and Is Open for Time Entry. This portlet provides Resource Managers and Project Managers a simple way to analyse which actuals have been submitted but not posted on specific tasks, as well as the aggregate pending hour total. Note: the information displayed is dependent on what the user has security rights to view.


Copyright 2023 • Rego Consulting Corporation • Privacy Policy