-
 Traditional project management isn’t dead, but it is heavily influenced by Agile teams and thinking. This course looks at ways you can help bring together disparate delivery units across the enterprise.
 -
 ** No Download - Do not Add to Cart ** As Clarity's Modern UX continues to evolve with each release, so has the transition conversation among Clarity Product Owners and Administrators. It's no longer a question of "if" and "when;" the question is, how? In this webinar, we'll explore some best practices that enable a successful shift from Classic to Modern. Through a collaborative discussion of overarching strategies to a step-by-step checklist, this session is designed to help you quickly position your users to take advantage of Clarity's latest and greatest capabilities. Nothing to Download - See Link below. http://info.regoconsulting.com/when-to-move-to-modernux-aug-2020
 -
 Wabtec shares how they utilized Clarity and Power BI to build an enhanced Resource Management monitoring solution.
 -

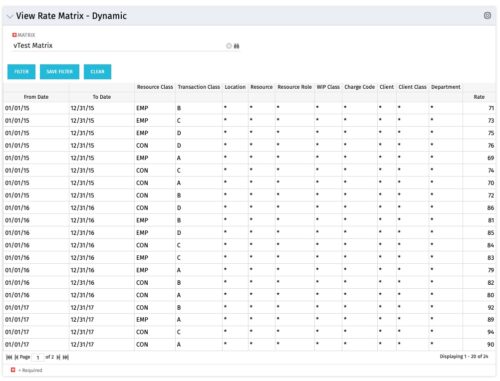 View Rate Matrix is a grid portlet that provides users a single place to view all the rates defined across multiple rate matrix without going to administration tab. Each Matrix may be defined with different columns (ex: Charge Code, Client, Department, Entity, Input type Code etc). This portlet dynamically brings only the columns associated with that rate matrix and provides the detailed information. User can view information related to one matrix at a time.
 -
View Rate Matrix is a grid portlet that provides users a single place to view all the rates defined across multiple rate matrix without going to administration tab. Each Matrix may be defined with different columns (ex: Charge Code, Client, Department, Entity, Input type Code etc). This portlet dynamically brings only the columns associated with that rate matrix and provides the detailed information. User can view information related to one matrix at a time.
-
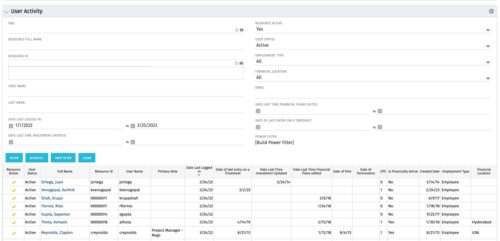 The User Activity portlet is in essence an expansion of the out of the box User List by License Type portlet, which only display the Last Logged In date of resources. This portlet offers several additional fields to help admins dig deeper into user activity within the tool. The table below describes the available filter fields for the portlet.
Column Label Description OBS OBS the resource(s) belong to Resource Full Name Resource’s First and Last Name Resource ID Resource’s ID First Name Resource’s First Name Last Name Resource’s Last Name Date Last Logged In Date the Resource last logged in Date Last Time Investment Updated Date the Resource last made an Investment update Resource Active The Resource’s active status Employment Type Resource’s Employment Type Financial Location Resource’s Financial Location Email Resource’s Email Address Date Last Time Financial Plans Edited Date the Resource last made a Financial Plan edit Date of last entry on a Timesheet Date the Resource last made an entry on a timesheet Created Date Date the resource was added to the system Date of Hire Resource’s Date of Hire Date of Termination Resource’s Date of Termination Financial Department Resource’s Financial Department Home Page Resource’s Home Page Language Default Language of the Resource Primary role Resource’s Primary Role Resource manager Resource’s Manager Track Mode Resource’s Track Mode User Name Resource’s Username -
The User Activity portlet is in essence an expansion of the out of the box User List by License Type portlet, which only display the Last Logged In date of resources. This portlet offers several additional fields to help admins dig deeper into user activity within the tool. The table below describes the available filter fields for the portlet.
Column Label Description OBS OBS the resource(s) belong to Resource Full Name Resource’s First and Last Name Resource ID Resource’s ID First Name Resource’s First Name Last Name Resource’s Last Name Date Last Logged In Date the Resource last logged in Date Last Time Investment Updated Date the Resource last made an Investment update Resource Active The Resource’s active status Employment Type Resource’s Employment Type Financial Location Resource’s Financial Location Email Resource’s Email Address Date Last Time Financial Plans Edited Date the Resource last made a Financial Plan edit Date of last entry on a Timesheet Date the Resource last made an entry on a timesheet Created Date Date the resource was added to the system Date of Hire Resource’s Date of Hire Date of Termination Resource’s Date of Termination Financial Department Resource’s Financial Department Home Page Resource’s Home Page Language Default Language of the Resource Primary role Resource’s Primary Role Resource manager Resource’s Manager Track Mode Resource’s Track Mode User Name Resource’s Username -
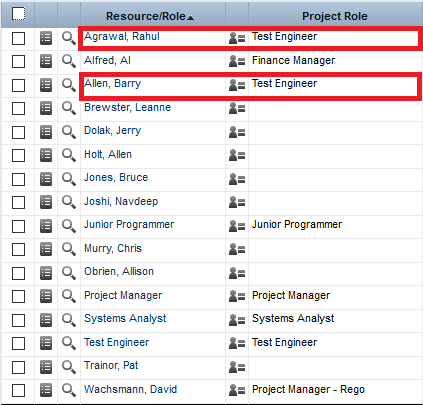
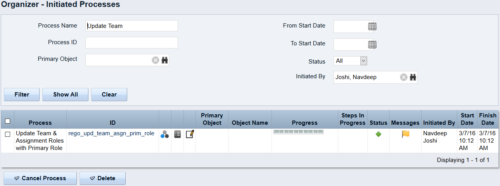 This process updates the team, assignment and timesheet roles with the primary role where they do not match. This way, the PM can push all roles to team and assignment for that project before they do a cost plan.
 -
This process updates the team, assignment and timesheet roles with the primary role where they do not match. This way, the PM can push all roles to team and assignment for that project before they do a cost plan.
-
This process updates the team, assignment and timesheet roles with the primary role where they do not match. This way, the PM can push all roles to team and assignment for that project before they do a cost plan.
-
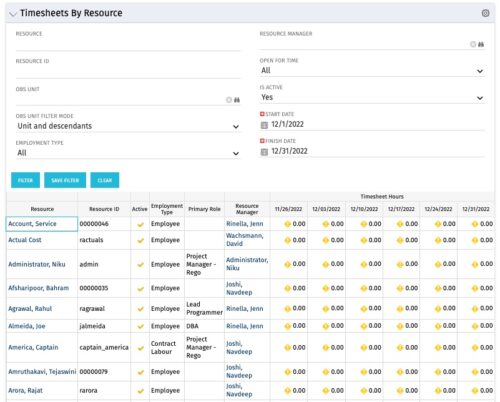 The Timesheets by Resource portlet gives the ability to highlight the time periods where resources are working overtime or working less than 25 hours a week. The filter requires timesheet Start Date and End Date to be provided. Additionally, the information can be filtered by Resource, Resource ID, OBS Unit, Employment Type, Resource Manager, Open for Time, and Active status. This portlet displays Resource, Resource ID, Active (yes/no), Employment Type, Primary Role, Resource Manager, and Timesheet Hours Flag. The flags are set with the logic
- Yellow = timesheets not posted / zero hour timesheets
- Green = where number of hours posted is > 25 and less than 45
- Red = where number of hours posted is < 25 or > 45
-
The Timesheets by Resource portlet gives the ability to highlight the time periods where resources are working overtime or working less than 25 hours a week. The filter requires timesheet Start Date and End Date to be provided. Additionally, the information can be filtered by Resource, Resource ID, OBS Unit, Employment Type, Resource Manager, Open for Time, and Active status. This portlet displays Resource, Resource ID, Active (yes/no), Employment Type, Primary Role, Resource Manager, and Timesheet Hours Flag. The flags are set with the logic
- Yellow = timesheets not posted / zero hour timesheets
- Green = where number of hours posted is > 25 and less than 45
- Red = where number of hours posted is < 25 or > 45
-
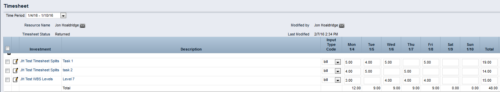
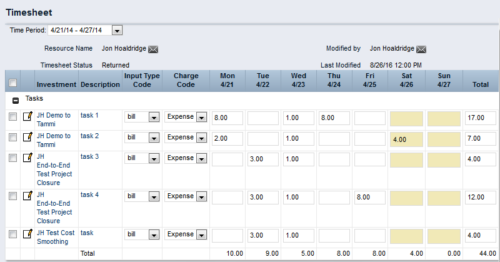 This process workflow with gel script forces billable hours on timesheet down to 40 hours, and sets overtime hours to non-billable. Timesheets with 40 or fewer hours are not touched. Process kicks off upon submission of timesheet. Steps are:
- Determine if timesheet has > 40 hours. If so, proceed.
- Create a SPLIT row for each timesheet row, with Input Type Code = Non-Bill.
- Divide 40 by total timesheet ours. Store this value.
- Multiply each timesheet cell by the stored value, and enter the result into that cell.
- Take the difference (original cell value – new cell value), and enter in same cell on Split row.
- The end result will be 40 hours total on Billable rows, and overtime hours on Non-Billable rows.
-
This process workflow with gel script forces billable hours on timesheet down to 40 hours, and sets overtime hours to non-billable. Timesheets with 40 or fewer hours are not touched. Process kicks off upon submission of timesheet. Steps are:
- Determine if timesheet has > 40 hours. If so, proceed.
- Create a SPLIT row for each timesheet row, with Input Type Code = Non-Bill.
- Divide 40 by total timesheet ours. Store this value.
- Multiply each timesheet cell by the stored value, and enter the result into that cell.
- Take the difference (original cell value – new cell value), and enter in same cell on Split row.
- The end result will be 40 hours total on Billable rows, and overtime hours on Non-Billable rows.
-
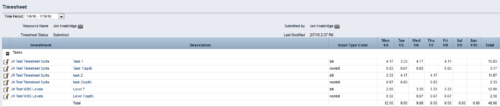
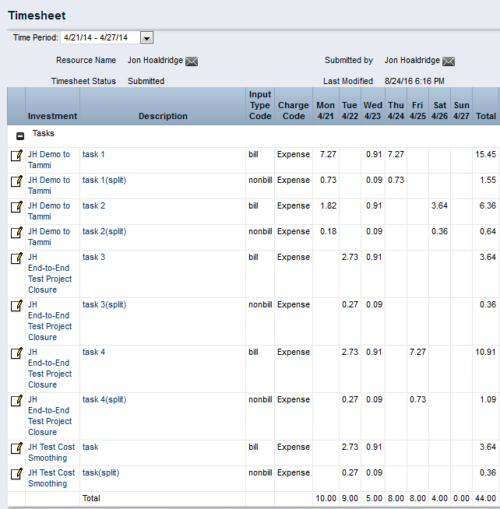
 The Timesheet Smoothing Process Workflow kicks-off when an individual timesheet is Submitted. It splits each transaction on the timesheet when total timesheet actuals exceed total weekly availability for the resource. Total weekly availability is determined by multiplying resource availability rate by the number of workdays in the week. Non-workdays include weekends, holidays, PTO, and other scheduled days off, as set on the resource calendar. If timesheet actuals <= total weekly availability, then the timesheet remains unchanged. But if timesheet actuals > total weekly availability, then the following occurs. Each timesheet transaction is reduced by a calculated percentage that will reduce the total regular hours to equal the total weekly availability. Then the remaining transaction hours are placed in a “Split” row for that task on that day, with an Input Type Code set based on a process parameter (which parameter can be set within the script action on the process). Note: If a single day has overtime hours, but the total timesheet actuals <= total weekly availability, no splitting occurs.
 -
The Timesheet Smoothing Process Workflow kicks-off when an individual timesheet is Submitted. It splits each transaction on the timesheet when total timesheet actuals exceed total weekly availability for the resource. Total weekly availability is determined by multiplying resource availability rate by the number of workdays in the week. Non-workdays include weekends, holidays, PTO, and other scheduled days off, as set on the resource calendar. If timesheet actuals <= total weekly availability, then the timesheet remains unchanged. But if timesheet actuals > total weekly availability, then the following occurs. Each timesheet transaction is reduced by a calculated percentage that will reduce the total regular hours to equal the total weekly availability. Then the remaining transaction hours are placed in a “Split” row for that task on that day, with an Input Type Code set based on a process parameter (which parameter can be set within the script action on the process). Note: If a single day has overtime hours, but the total timesheet actuals <= total weekly availability, no splitting occurs.
-
 The Timesheet Notes portlet displays all timesheet notes split out by resource, investment and task. This is very useful in situations where you want to review multiple notes as you do not have to open each note separately. The table below describes the available filter fields in the portlet.
Column Label Description Timesheet Period Start Range of time periods to display filtered by start date Timesheet Period Finish Range of time periods to display filtered by finish date Resource Resource(s) to display Type Note on a timesheet or time entry (task specific) -
The Timesheet Notes portlet displays all timesheet notes split out by resource, investment and task. This is very useful in situations where you want to review multiple notes as you do not have to open each note separately. The table below describes the available filter fields in the portlet.
Column Label Description Timesheet Period Start Range of time periods to display filtered by start date Timesheet Period Finish Range of time periods to display filtered by finish date Resource Resource(s) to display Type Note on a timesheet or time entry (task specific) -
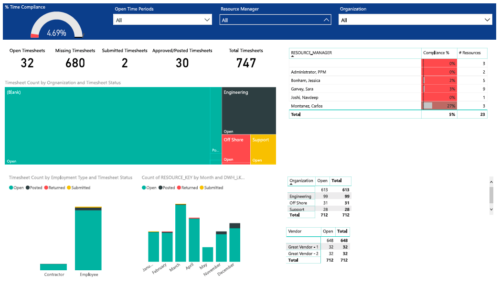 Timesheet compliance is a dashboard containing multiple visualizations that shows timesheet compliance data under various scenarios. Dashboard shows count of timesheets grouped by Status and total available timesheets. % Time Compliance – Gauge graph that shows percentage of completed timesheets against overall timesheets. Compliance by Resource Manager – Grid section that shows percent timesheet compliance by resource manager. Timesheet count by Employment type and Timesheet Status – Stacked column chart, each column represents Employment type and sections of the column represent count of timesheets by Status. Count of Timesheets by Months – Stacked column chart, each column represents a month and sections of the column represent count of timesheets by Status. Dashboard also const of two grid sections displaying number of Open timesheets by Organization and Vendor.


Copyright 2023 • Rego Consulting Corporation • Privacy Policy