
790 results
-
 Without good data, your digital transformation won’t succeed. This session talks about generating and understanding value stream metrics, including how investments and teams are performing.
 -
 A presentation slide deck from Rego University 2022. Broadcom’s presentation on organizing an Agile Enterprise.
- Prepare your renovation plan
- Assess and update your systems
- Finish the interior
- Finish the exterior (and preparing for bad weather)
- Final inspection
-
 Join Rego’s senior Agile guides and learn best-practice usage patterns to support your ART-level practices with Rally Software. We’ll explore all the ceremonies in a team-of-team (ART) program increment and how you can use Rally to align, simplify, and leverage for scaled delivery of high-value solutions.
 -
 Part of the Business Transformation collection, this grid portlet displays idea details for all ideas (active and inactive) and all status conditions. This is an editable portlet based on the Ideas data provider. Filterable by OBS structure, Active/Inactive, and Status.
 -
Part of the Business Transformation collection, this grid portlet displays idea details for all ideas (active and inactive) and all status conditions. This is an editable portlet based on the Ideas data provider. Filterable by OBS structure, Active/Inactive, and Status.
-
Part of the Business Transformation collection, this grid portlet displays idea details for all ideas (active and inactive) and all status conditions. This is an editable portlet based on the Ideas data provider. Filterable by OBS structure, Active/Inactive, and Status.
-
 Part of the Business Transformation Content collection, this bar chart portlet displays count of ideas per business unit. This provides a holistic view of the idea pipe-line in an organization providing them a high-level of ideas converted, approved, unapproved per business unit.
 -
Part of the Business Transformation Content collection, this bar chart portlet displays count of ideas per business unit. This provides a holistic view of the idea pipe-line in an organization providing them a high-level of ideas converted, approved, unapproved per business unit.
-
Part of the Business Transformation Content collection, this bar chart portlet displays count of ideas per business unit. This provides a holistic view of the idea pipe-line in an organization providing them a high-level of ideas converted, approved, unapproved per business unit.
-
 Pie Chart displays count of all Ideas by Department. Filterable by Active and Inactive, by OBS, and by Department Manager. Data label and mouse-over show department counts. Legend displays department names.
 -
Pie Chart displays count of all Ideas by Department. Filterable by Active and Inactive, by OBS, and by Department Manager. Data label and mouse-over show department counts. Legend displays department names.
-
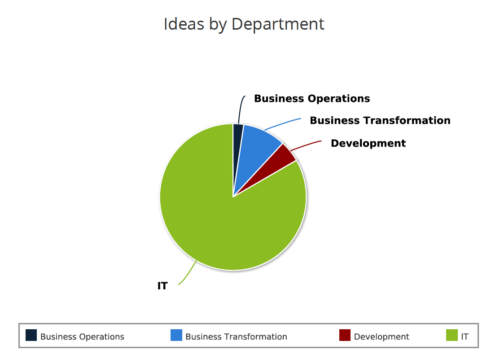 Ideas by Department report is a pie chart that displays count of ideas by department. Mouse over on the pie chart displays idea count for that department. You can further narrow your search by OBS Type & Path , Idea Status, Idea Start Date and Is Idea Active?.
 -
 Pie Chart displays total Ideas by Priority, filterable by Active / Inactive and by OBS structure. Data Label and Mouse-over label display counts by Priority. Legend shows Priority Name. Chart also shows Ideas with No Priority.
 -
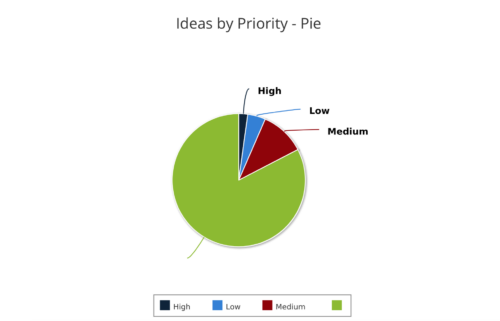 Ideas by Priority report is a pie chart that displays ideas count by priority. Mouse over on the pie chart displays idea count for that priority. You can further narrow your search by OBS Type, OBS Path, Idea Status, Idea Start Date and Is Idea Active?
 -
 Hear what the journey from Project to Product looks like from the trenches. IHG will share tales of what it took to make this transition, some challenges they faced, and what outcomes they have been able to achieve.
 -
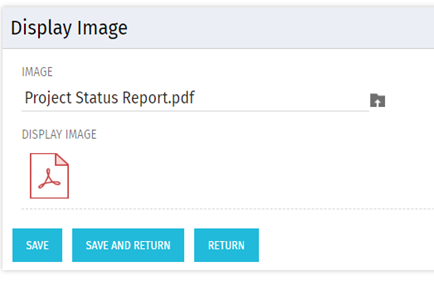 There are many times user’s wants to see the preview of file uploaded on attachment attribute. This Technical Trick will illustrate the steps for an Administrator to preview an attachment. This solution will help to preview PDF, Text file and Image(.png) file. For Microsoft word, PowerPoint and Microsoft Excel, it displays an icon.
 -
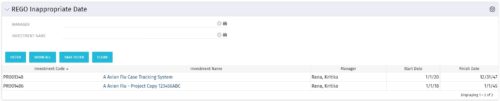 This grid portlet to show projects with finish or start date of project more than 20 years in future or past. The portlet automatically displays results when accessed. The user can apply filters to fetch the desired information.
 -
This grid portlet to show projects with finish or start date of project more than 20 years in future or past. The portlet automatically displays results when accessed. The user can apply filters to fetch the desired information.
-
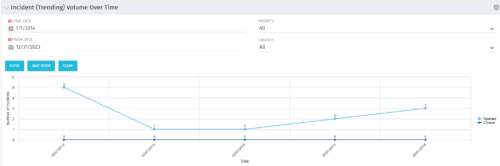 This view depicts trends of created and resolved Incidents over time, grouped by month. The count of incidents opened is determined by the Created Date of the Incident, and the count of Incidents closed is determined by the Resolution Date of the Incident. The view is filterable by Priority and Urgency as well as a date range. NOTE: The values returned are the total sum for a given month, not a cumulative total over time.
 -
This view depicts trends of created and resolved Incidents over time, grouped by month. The count of incidents opened is determined by the Created Date of the Incident, and the count of Incidents closed is determined by the Resolution Date of the Incident. The view is filterable by Priority and Urgency as well as a date range. NOTE: The values returned are the total sum for a given month, not a cumulative total over time.
-
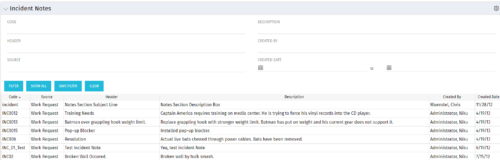 The Incident Notes portlet displays all of the notes that have been entered against Incidents in a single view. This allows users to more efficiently look at the notes, regardless of security rights, without having to enter each incident individually to view them.
 -
The Incident Notes portlet displays all of the notes that have been entered against Incidents in a single view. This allows users to more efficiently look at the notes, regardless of security rights, without having to enter each incident individually to view them.
-
The Incident Notes portlet displays all of the notes that have been entered against Incidents in a single view. This allows users to more efficiently look at the notes, regardless of security rights, without having to enter each incident individually to view them.
-
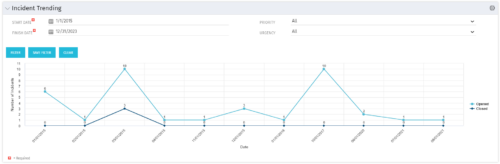 The Incident Trending portlet all opened and closed incidents within a certain time frame. This portlet will show trends in incidents over previous months and allows for analysis of as to the root cause in a spike of incidents. The information may be filtered by date range, urgency and priority.
 -
The Incident Trending portlet all opened and closed incidents within a certain time frame. This portlet will show trends in incidents over previous months and allows for analysis of as to the root cause in a spike of incidents. The information may be filtered by date range, urgency and priority.
-
The Incident Trending portlet all opened and closed incidents within a certain time frame. This portlet will show trends in incidents over previous months and allows for analysis of as to the root cause in a spike of incidents. The information may be filtered by date range, urgency and priority.
-
 An engaging, informative session delivered to your organization by a Prosci change management expert. Your leaders, project managers, and others focused on project outcomes will learn how applying change management to projects can increase the likelihood of those projects succeeding. They will also learn about the processes, people and tools needed to align project management and change management.
 -
 You can’t wait, integrate! Clarity is highly capable of being the center of a hub and spoke ecosystem for your project delivery. With flexible integration options and robust portfolio reporting and decision support functionality, Clarity will help you consolidate data from multiple systems of record into one source of truth. Join this class to see common use cases for optimizing a PPM delivery value stream that cuts across a diverse suite of applications, including HR, Finance, ITSM, Agile, Work Management, and many more.
 -
 Do you want to add interfaces to your CA PPM instance? This class will review the pros and cons of various integration methods and provide best practice on how to handle various interfaces. We’ll walk you through specific interface examples and showcase Rego’s pre-built interface sets you can leverage to reduce the time and cost of implementation.
 -
 Course Description: In the new bimodal IT environment, does your organization lack insights into what Agile work is being done and what value is being delivered? Learn how Apptio Agile Insights merges data from multiple Agile tools, including Clarity PPM, to bring together a total picture of the value IT is delivering.
 -
 The Investment Resource Rate portlet allows a user to search for effective (or missing) rates for resources across all investment types. It pulls rate information from the matrix extraction tables and includes currency conversion if the environment supports multiple currencies. The portlet can be used both to search for the rate of any given resource and to determine which resources might be missing rates when an error is generated when attempting to populate a cost plan (REVMGR-20728:Rates and Costs are both missing for one or more roles/resources).
 -
The Investment Resource Rate portlet allows a user to search for effective (or missing) rates for resources across all investment types. It pulls rate information from the matrix extraction tables and includes currency conversion if the environment supports multiple currencies. The portlet can be used both to search for the rate of any given resource and to determine which resources might be missing rates when an error is generated when attempting to populate a cost plan (REVMGR-20728:Rates and Costs are both missing for one or more roles/resources).
-
 This portlet will allow administrators or other managers to see what resources have been granted instance rights to any investment. Filtering is available by resource, investment or right.
 -
This portlet will allow administrators or other managers to see what resources have been granted instance rights to any investment. Filtering is available by resource, investment or right.
