-
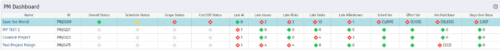 The PM Dashboard portlet provides an overview of all projects for which the user is the Project Manager without navigating to and opening each project individually. All critical information related to the project status is displayed in this portlet. Status indicators display the project’s statuses. Graphical stoplights and numbers provide an overview of all late Action items, Issues, Risks, Tasks, and Milestones.
 -
The PM Dashboard portlet provides an overview of all projects for which the user is the Project Manager without navigating to and opening each project individually. All critical information related to the project status is displayed in this portlet. Status indicators display the project’s statuses. Graphical stoplights and numbers provide an overview of all late Action items, Issues, Risks, Tasks, and Milestones.
-
 Course Description: This class will provide a list of daily and weekly activities that every project manager should follow to leverage Clarity PPM more effectively.
 -
 The Project Risk Register report provides visibility into project risks, including detailed information on each risk and its associated items such as notes, action items, tasks, and related risks or issues. Results can be grouped by project or viewed without grouping to support flexible analysis. Interactive visuals make it easy to track, monitor, and manage risks across projects.
 -
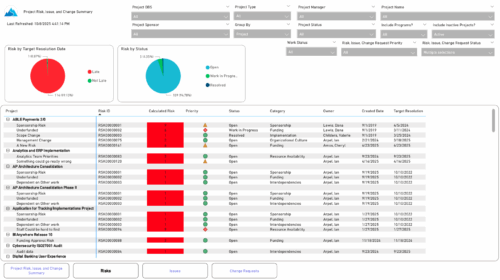 The Project Risk, Issue, and Change Summary report provides an overview of project health by visualizing risks, issues, and change requests. It includes pie charts that display counts by target resolution or expected close date, as well as by status. A detailed table lists each item’s name, ID, priority, status, category, owner, creation date, and resolution or close date. Results can be grouped by project or viewed without grouping to support flexible analysis and tracking.
 -
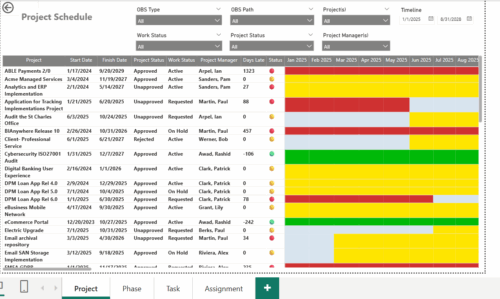 The Project Schedule report provides visibility into project schedule, including detailed information on days late, status and its associated items such as detailed info of schedule on Phase level, Task level and assignment level. Results are grouped by project in Phase, Task and assignment sections or can be viewed without grouping to support flexible analysis for projects. Interactive visuals make it easy to track, monitor, and manage schedule across projects.
 -
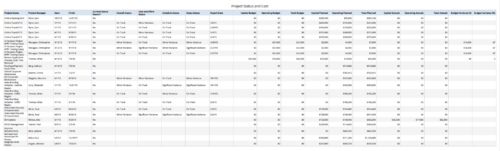
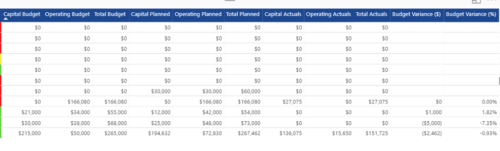
 The portlet shows the Overall Status and Budget Status and Amounts. It displays one row per project. The portlet shows the following main fields: Overall Status, Budget Status, Capital Budget, Operating Budget, Total Budget, Capital Planed, Operating Planned, Total Planned, Capital Actuals, Operating Actuals, Total Actuals, Budget Variance ($), Budget Variance (%) Displaying the budget variance allows the PM to understand of the project is over / under spent, and thus the costs planning needs to be re-visited.
 -
The portlet shows the Overall Status and Budget Status and Amounts. It displays one row per project. The portlet shows the following main fields: Overall Status, Budget Status, Capital Budget, Operating Budget, Total Budget, Capital Planed, Operating Planned, Total Planned, Capital Actuals, Operating Actuals, Total Actuals, Budget Variance ($), Budget Variance (%) Displaying the budget variance allows the PM to understand of the project is over / under spent, and thus the costs planning needs to be re-visited.
-
 Project Status and Costs report gives the Project Manager a single place to view various Project Statuses ( Cost and Effort, Schedule, Scope and Overall ) and Costs ( Planned, Budget & Actuals ) for multiple projects. User can further narrow their search by OBS Type & Path, Project Name, Project Manager and Is Project Active?.
 -
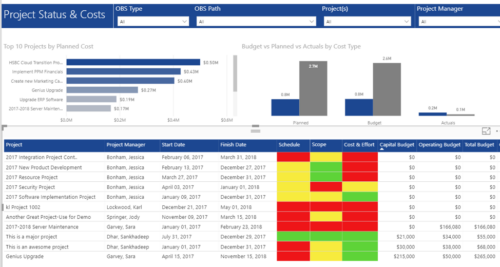 Project Status and Costs report has the details of the Project Schedule, Scope, Cost and Effort Statuses along with Planned, Budget & Actuals costs. There is also graphical representation that shows Top 10 projects by Planned Cost, Budget vs Planned vs Actuals by Cost Type. User can further narrow their search by OBS Type & Path, Project(s) and Project Manager.
 -
 The Project Status Detail report provides a comprehensive view of each project’s key elements, including team allocations, major milestones, risks, issues, and change requests. It highlights the most relevant project indicators to give stakeholders a clear understanding of project health and progress. This report supports detailed tracking and review of project performance across multiple dimensions.


Copyright 2023 • Rego Consulting Corporation • Privacy Policy