-
 This training document is a Rego Consulting Quick Reference Guide to assist with Idea approval and conversion to projects in Clarity’s Modern User Experience. This doc references version 16.1 views. Doc reviews setting Ideas as Approved and converting Ideas to projects.
 -
 This training document is a Rego Consulting Quick Reference Guide to assist resource managers with the adjusting of timesheets. This doc references version 16.1 views. Document provides guidance on how to use the Review & Approve tab to adjust time that has already been entered by a resource.
 -
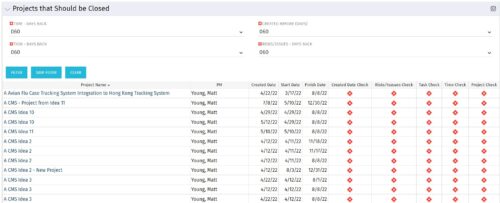
The Projects That Should Be Closed portlet displays all projects that have been created before the specified filter date and has had no new time, tasks, or risks/issues updated after the dates specified in the filter. This can assist in identifying projects that are completed or cancelled and should be closed. The table below describes the available columns in the portlet. Column Label Description Project Name Name of the project PM Manager of the project Created Date Created Date of the project Start Start Date of the project Finish Finish Date of the project Created Date Check Identifies if the project meets the Created Before (Days) filter Risks/Issues Check Identifies if the project meets the Risk/Issues – Days Back filter Task Check Identifies if the project meets the Task – Days Back filter Time Check Identifies if the project meets the Time – Days Back filter Project Check Identifies if the project meets the portlet filter Criteria id Internal code used by the query -
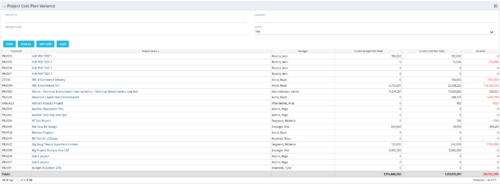 The Project Cost Plan Variance displays the variance between the budget and cost plans for projects the logged in user has security rights to view. The total for the Cost Plan that is marked as the Plan of Record for the project (Current Cost Plan Total), alongside the total for the current approved Budget Plan (Current Budget Plan Total). These two values are then compared in order to generate the total current Variance for the project. A positive amount in the Variance column indicates the project is under budget, while a negative amount indicates the project is over budget. Results may be filtered by: Project ID, Project Name, Manager, and whether the project is Active (Yes, No, All). By default, the portlet will display only Active projects.
 -
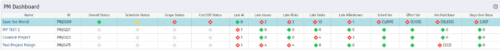 The PM Dashboard portlet provides an overview of all projects for which the user is the Project Manager without navigating to and opening each project individually. All critical information related to the project status is displayed in this portlet. Status indicators display the project’s statuses. Graphical stoplights and numbers provide an overview of all late Action items, Issues, Risks, Tasks, and Milestones.
 -
The PM Dashboard portlet provides an overview of all projects for which the user is the Project Manager without navigating to and opening each project individually. All critical information related to the project status is displayed in this portlet. Status indicators display the project’s statuses. Graphical stoplights and numbers provide an overview of all late Action items, Issues, Risks, Tasks, and Milestones.
-
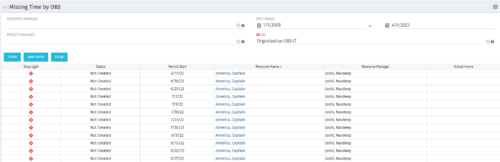 The Missing Time by OBS portlet displays all missing or late timesheets for resources staffed within a specific OBS. Resources will be included if they are open for time entry, have the track mode of ‘Clarity’ and have a timesheet that is not posted. The portlet accommodates for hire and termination dates. Also, the portlet only shows resources that the active user has the security rights to view. Administrators and the Project Management Office may use this portlet to determine the timesheet status of all resources within a specific OBS in open time periods. This portlet allows a user to quickly search by OBS and view all timesheets under that area. After selecting the OBS, the user can also filter on time period start date, Resource Manager and/or Project Manager. The portlet will display a ‘Stop Light’ indicator based on timesheet status, the status, period start, Resource Name, Resource Manager and any actual hours entered for the timesheet.
 -
 The Executive Dashboard portlet displays information regarding projects the user has security rights to view. It provides a one-stop place for the PMO or management to view all critical information about projects. The portlet not only displays status indicators as well as dates for late items, variances and days late, but also displays the project status fields from the Status Report sub-object.
 -
 The Resource Data Issues portlet is used to identify data exceptions related to resource setup. This portlet helps to identify where resources are missing key data or are possibly sitting in an exception state. This view will show resources that have one or many exceptions, including inactive resources. There is no security built into this portlet - all resources will show. The only required field in the filter is Days, which is the number of days since the user last logged in. The user may also narrow the results by resource, OBS, or project type.
 -
 The Capacity Graph portlet displays Availability, Allocations, Actuals and Assignments for a Clarity user in a single view. This portlet pulls data from timeslices, and allows the user to filter on a weekly, monthly or quarterly data. The Estimated Time to Complete (ETC) and Allocation data will only show for projects that are active. This portlet provides a Clarity user with a simple way to analyse their: Allocations vs. Availability, Allocations vs. Actuals, Allocations vs. ETC and ETC vs. Availability. The graph allows the user to determine where areas of improvement may exist and quickly identify potential areas of constraint.
 -
 The Key Tasks & Milestone Status report delivers comprehensive visibility into task and milestone performance through intuitive Start Date and Finish Date visualizations. It consolidates critical execution details, including task status, WBS type, and associated attributes such as project name, project manager, overall project status, and task completion percentage. The report supports dynamic filtering across multiple dimensions, including projects, OBS path, OBS type, task status, and WBS type, enabling targeted analysis and rapid insight. Interactive dashboards facilitate effective tracking, monitoring, and governance of tasks and milestones across the projects.
 -
 The Project Status Detail report provides a comprehensive view of each project’s key elements, including team allocations, major milestones, risks, issues, and change requests. It highlights the most relevant project indicators to give stakeholders a clear understanding of project health and progress. This report supports detailed tracking and review of project performance across multiple dimensions.


Copyright 2023 • Rego Consulting Corporation • Privacy Policy