-
 The need to report and organize work around the Products continues to grow. Join this session to hear how Project and Product Management can thrive together in Clarity.
 -
 This session will align you with best practices for using Clarity's project management functionality. Come and learn about the OOTB capabilities for excellent project management, including: scheduling, assignments, staffing, views, financial plans, and other general project management capabilities. Additionally, tips and tricks will be shared, providing you with a toolkit of ideas for your organization!
 -
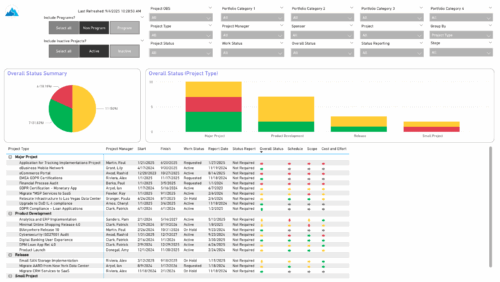 The Project Status Report List provides a consolidated view of project health, including schedule dates, work status, and key status indicators. Users can group results by Portfolio Category, Overall Status, Project Type, Stage, Project Manager, Sponsor, or OBS Level, with the report dynamically adjusting its columns based on the grouping selected. Visuals include an overall status pie chart that shows the percentage of projects by status color, and a column chart that breaks down project counts by status, aligned to the chosen grouping option.
 -
 This training document is a Rego Consulting Quick Reference Guide to assist with Idea approval and conversion to projects in Clarity’s Modern User Experience. This doc references version 16.2.1 views. Doc reviews setting Ideas as Approved and converting Ideas to projects.
 -
 Without good data, your digital transformation won’t succeed. This session talks about generating and understanding value stream metrics, including how investments and teams are performing.
 -
 With only 15% of companies successfully transforming digitally, it’s time for the PMO to take charge. This session talks about how the PMO effectively can support the digital transformation within the enterprise by reimagine its traditional charter
 -
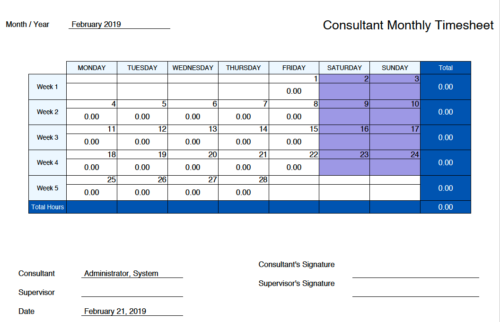 Monthly Actuals -User View is a standard calendar view of actuals posted by logged in user on each day of the selected month. Actuals also includes timesheets that haven’t been submitted/posted yet. Actual hours on the report are tied to user's availability i.e. when user has 0 availability (Saturday/Sunday/Holiday) then actuals are greyed out.
 -
 This portlet shows the project costs by Month. The information displayed includes:
- Start Date for project
- End Date for project
- Budgeted Cost
- Planned Cost
- Actual Hours
-
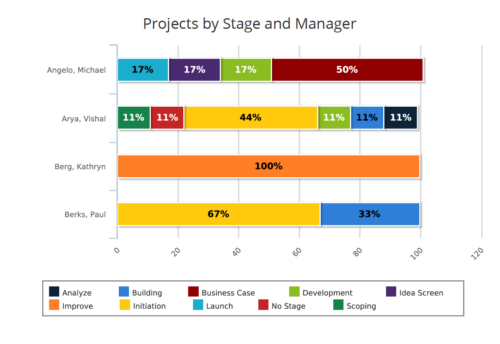 Projects by Stage and Manager report is a stacked bar chart that displays percentage of projects associated with project manager at a particular stage. Legend displays colors used to represent various Project Stages. This report provides to PMO a quick snapshot of where certain projects are sitting with each Project Manager. You can further narrow your search by Project Manager, Project Name, Is Project Active? , Is Template? And Is Program?
 -
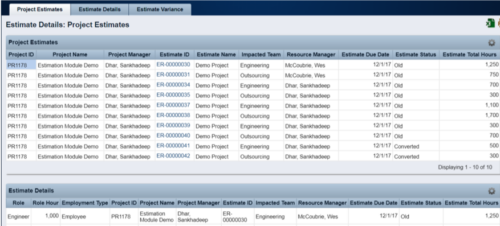 The Rego Estimation Module Provides a more accurate estimate earlier in the idea/project lifecycle.
- Is applied consistently so it can be improved.
- Retains the data in Clarity to enable analysis.
- Provides ongoing feedback by comparing estimates to current EAC.
- Provides historical record of estimating for projects overall as well as change requests.
-
 An HTML portlet that displays two buttons that link the user instantly to an object create page. The portlet comes with two buttons and the buttons can be modified to link to any creation page. Administrator can choose: Project, Idea, Application, Program, etc.
 -
 This training document is a Rego Consulting Quick Reference Guide to assist with utilization of the Staffing page in Clarity’s Modern User Experience. This doc references version 16.0.3 views. Document provides detail on the layout and capabilities of the Staff Grid as well as the Allocations Timeline. Information is provided on columns, widgets and filtering. Instructions are provided on how to save Views. Summary information is provided on the layout of the Allocation Timeline and includes detail on the Investment Timeline and the Resource Histogram. Investment Timeline summary contains information on the Allocations by Investments and the Allocations by Resources tabs. While the Resource Histogram section provides screenshots on Resource Availability and Resources by Role.


Copyright 2023 • Rego Consulting Corporation • Privacy Policy