-
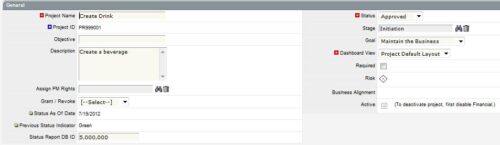
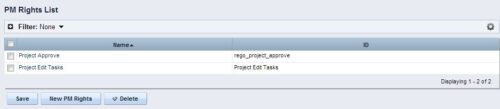 The Allow PM to Give Certain Rights modification allows the project manager to delegate rights (chosen by the administrator on the PM Rights object) on his or her projects. This modification eliminates the need for project managers to request additional rights through the PMO/management and simplifies the entire process for everyone involved. The system administrator is able to customize the PM Rights object to pick which rights should be granted to users by the process. The process begins when a change is made on the newly created “Grant / Revoke” field on the project object. The process will then grant or revoke (depending on what option is selected) any rights listed in the PM Rights object to the user in the “Assign PM Rights” field on the project object.
 -
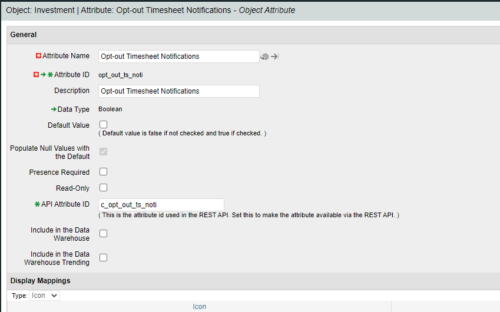
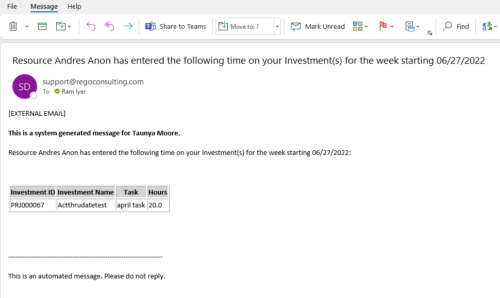 Notify the PM with a list of tasks for their project as soon as the Timesheet is submitted. This is a good substitute for PM approval. When a timesheet is submitted, then the PM knows the time entered by person. This is an Auto-start process in Clarity named PM Time Notification - On Timesheet Submission and will be automatically spawned when a Timesheet is submitted. When the process is started it will be seen in the Initiated on the Processes tab. The process status can be monitored from Running to the Completed stage. The Progress when 100% and the Status is Completed, an email would have arrived to the Project Manager with subject: “Resource <Name> has entered the following time on your Investment(s) for the week starting <Timesheet Start Date> ”. This email will list the Investments managed by the PM where task was entered by the Resource submitting the timesheet. Each PM would get a separate notification. PM for project X notified, and PM for project Y gets notified in another email. Therefore, one timesheet may spawn out multiple emails. But, if both the Projects have the Same PM, then only a single email gets sent out. “Opt-out Timesheet Notifications" checkbox is provided on the Project for PM’s who do not want to get notified on those projects.
 -
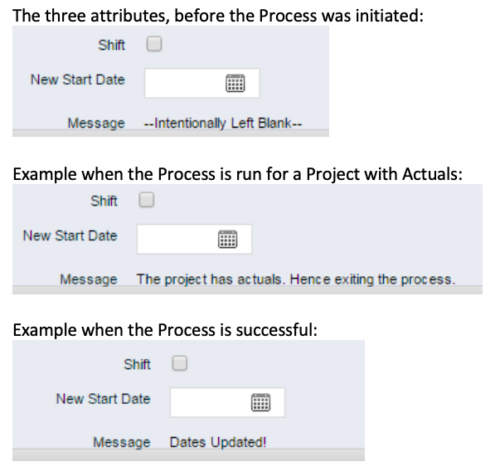 This process, Shift Project Dates, helps Project Managers change an entire Project / Idea’s dates to a new start date. Once the three attributes are added to the Idea /Project Views, the PM can trigger the process by entering a date in the New Start Date field and checking the Shift checkbox. The process runs automatically on Save. The process calculates the date difference between the original Start Date and New Start Date then shifts all Allocation, Task, and Assignment dates by the calculated difference. For example, if a Project is set to begin on January 1st and needs to be pushed to a February 1st start date, the process first determines that there are 31 days between the original start date and the new date. Next the process increases the start date for each Task, Allocation and Assignment by 31 days. NOTE: The process will shift Allocation dates regardless of resource restrictions such as a Termination Date or non-working time as marked on their calendar. The Team page will reflect the Available Start and Finish as shifted by the process, but the Allocation hours and % will take unavailable time into account. For example, if a shift process sets the start date for a resource to be after their date of termination the dates will change by the date difference, but the Allocation hours will correctly be calculated as zero.
 -
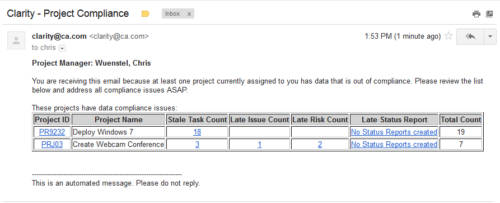 The Project Compliance Stalker – PM sends an email to Project Managers (and also their managers if so desired) at a set interval to alert them to project compliance issues. Areas of compliance that are reviewed include: stale project tasks (stale = past due date), late issues and risks (past due date) and late status reports.
 -
 The Grant Team Project Edit Rights workflow allows a project manager to grant Project – Edit Management rights to all users staffed on the project. This workflow saves not only the project manager time by allowing all users on the project to update information, but also saves the administrator time from granting each resource these rights individually. The process will also remove any rights from members that have been removed from the project.
 -
 The Status Report Publish workflow process pushes values from the status report sub-object to the parent project object. The process is started when the user ticks the “Publish” Boolean field on the status report (custom field added). This workflow will update the project object with the overall status indicator, the status comment, the previous overall status, and the as of date. This eliminates the project manager having to update the fields in both the status report and the project overall.
 -
 The PM Stalker – Submit Status Report workflow process will email any project manager that has not submitted a status report in the last two weeks. This process will ensure that all status reports are kept up-to-date and provide management with a reliable overview of the status on the project.
 -
 Course Description: This class will provide a list of daily and weekly activities that every project manager should follow to leverage Clarity PPM more effectively.
 -
 It is quite common for Rally and Jira to coexist. However, connecting them effectively enhances the value stream for development teams and product owners. Learn what is available to make this happen along with some typical design patterns.
 -
 The Dashboard: Project Status Single-line portlet gives an overview of the project overall status as well as the status indicators on the "current" status report object. The portlet will pull the "id" from the page it is placed on, so this portlet is usually placed on the project dashboard tab. This portlet displays the report date, symbols relating to the overall status, scope, schedule, cost/effort, and the overall explanation across a single line in the portlet.
 -
 Rally Software introduction including high level feature and functionality for Agile and portfolio planning and tracking, analytics and reporting, and overall benefits of Rally in the marketplace along with a product demo.
 -
 It is quite common for Rally and Jira to coexist. However, connecting them effectively enhances the value stream for development teams and product owners. Learn what is available to make this happen along with some typical design patterns.


Copyright 2023 • Rego Consulting Corporation • Privacy Policy