-
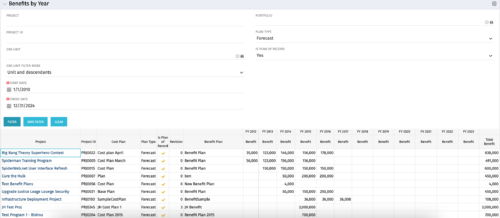 The Benefits by Year portlet summarizes Benefit totals by year and is searchable by Project, OBS and Portfolio. The results display both Budgeted Benefit Plans and Forecast Plans and the associated Cost Plan. Users can make use of this portlet to view Benefit Plan totals across an OBS or Portfolio or to compare the Budgeted Benefit of a Project versus the current plan.
 -
 The Dashboard: Project Status Single-line portlet gives an overview of the project overall status as well as the status indicators on the "current" status report object. The portlet will pull the "id" from the page it is placed on, so this portlet is usually placed on the project dashboard tab. This portlet displays the report date, symbols relating to the overall status, scope, schedule, cost/effort, and the overall explanation across a single line in the portlet.
 -
 The Time By Type - Pie Chart portlet is a graphical representation of time by type of investment for all resources the logged in user has security rights to view. This portlet pulls from the daily timeslices, and can be used for determining what types of projects receive the majority of hours. The filter option allows for entry of a specific start date and finish date.
 -
 The Dashboard: Open Risks portlet gives an overview of all risks that are not closed or resolved for a single project. The portlet will pull the "id" from the page it is placed on, so this portlet is usually placed on the project dashboard tab. The portlet sorts the risks first by priority and then by target date. It displays the name, owner, target date, probability impact, and priority.
 -
 The Dashboard: Open Milestones portlet gives an overview of all milestones that are started or not started for a single project. The portlet will pull the "id" from the page it is placed on, so this portlet is usually placed on the project dashboard tab. The milestones are sorted by Due Date. It displays the name, Due Date, Baseline Date, Days Late (Due Date – Baseline Date), and Days Old (Current Date – Due Date).
 -
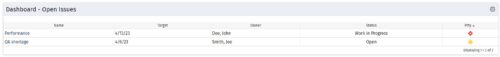 The Dashboard: Open Issues portlet gives an overview of all issues that are not closed or resolved for a single project. The portlet will pull the "id" from the page it is placed on, so this portlet is usually placed on the project dashboard tab. The portlet sorts the issues first by priority and then by target date. It displays the name, target date, owner, status and priority.
 -
The Dashboard: Open Issues portlet gives an overview of all issues that are not closed or resolved for a single project. The portlet will pull the "id" from the page it is placed on, so this portlet is usually placed on the project dashboard tab. The portlet sorts the issues first by priority and then by target date. It displays the name, target date, owner, status and priority.
-
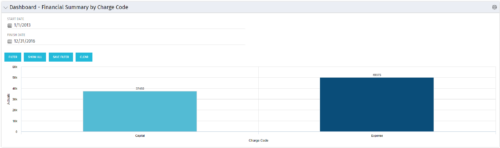 The Dashboard: Financial Summary by Charge Code portlet displays financial information from the project summarized by Charge Code. The portlet is added to the dashboard page of a project and will pull all actuals by charge code on the project. The user may filter by date range to narrow the results.
 -
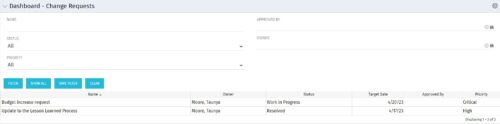 The Dashboard: Change Requests portlet gives an overview of all change requests on the project. The portlet will pull the "id" from the page it is placed on, so this portlet is usually placed on the project dashboard tab. The portlet sorts the issues first by priority and then by target date. It displays the name, owner, status, target date, approved by, and the priority.
 -
The Dashboard: Change Requests portlet gives an overview of all change requests on the project. The portlet will pull the "id" from the page it is placed on, so this portlet is usually placed on the project dashboard tab. The portlet sorts the issues first by priority and then by target date. It displays the name, owner, status, target date, approved by, and the priority.
-
 This training document is a Rego Consulting Quick Reference Guide to assist in the replacement of roles with named resources in Clarity’s Modern User Experience. This doc references version 16.1 views. Document provides detail on soft bookings, default allocation and requested manager. Instructions are provided on how to access requests from the Staffing Plan view and how to swap the role for a named resource. If requests are not fulfilled in their entirety, details are provided on how the excess allocation is handled.
 -
 This training document is a Rego Consulting Quick Reference Guide to assist with the creation and editing of Tasks in the Timeline View of Clarity’s Modern User Experience. This doc references version 16.1 views. Doc covers how to create a new task in the Timeline View, how to insert sibling or insert child tasks, how to set Milestones, access the Details pane and add resource Assignments. Also details how to move tasks by clicking and dragging within the Timeline View.
 -
 This training document is a Rego Consulting Quick Reference Guide to assist with population of project properties in Clarity’s Modern User Experience. This doc references version 16.1 views. Doc covers Project Tiles View, Project Properties – Details page and updating from the Project List view.
 -
 This training document is a Rego Consulting Quick Reference Guide to assist with the utilization of some of the most common components in Clarity’s Modern User Experience. This doc references version 16.1 views. Document includes content on Grid View, View Options, Adjust Columns, Details Panel, Group By, Save Views and Manage Views.
 -
 A presentation slide deck from Rego University 2022. This document reviews the model for using Clarity and an Agile tool in a Bi-Modal fashion to improve data and reporting.
- Agile Journey
- Bi-Modal – what is it really and why is it important?
- Value of getting everything together: Planning to Execution
- How to Integrate
-
 A presentation slide deck from Rego University 2022. The document covers Doing Agile, Agile Manifesto and then Being Agile.
 -
 A presentation slide deck from Rego University 2022. This is a document used to moderate a round table discussion at Rego U.
- What are the Agile Buzz-words and what do they mean?
- Are the Scrum Master and Product Owner roles really full-time?
- Do we need PMs when moving to Agile?
- What’s the role of a Business Analysist in Agile?
- How do you manage a PPM portfolio with Agile teams?
- How do you know when it’s time to “go off-script?”
-
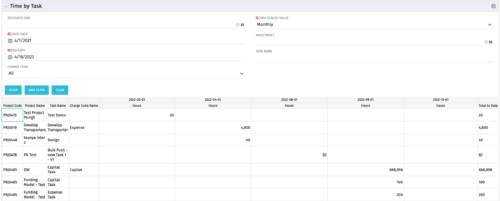 The Time by Task portlet displays time logged to tasks for all investments the logged in user has security rights to view - pulling data from the timeslices. It is capable of displaying the data by weekly, monthly, quarterly or annually segments. The portlet may also be filtered by investment and resource OBS.
 -
The Time by Task portlet displays time logged to tasks for all investments the logged in user has security rights to view - pulling data from the timeslices. It is capable of displaying the data by weekly, monthly, quarterly or annually segments. The portlet may also be filtered by investment and resource OBS.
-
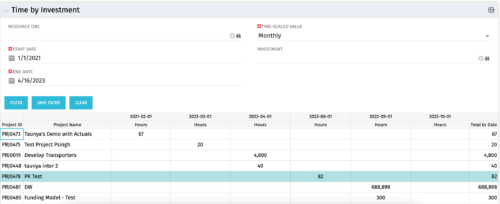 The Time by Investment portlet displays time logged to investments for all investments the logged in user has security rights to view using data from timeslices. It is capable of displaying the data by annual, quarterly, monthly, weekly, and daily segments with totals per date also being presented. The portlet may can be filtered by investment, resource OBS, and time segments. This portlet can be used as a management and governance tool to review aggregate hours posted to investments by time period.
 -
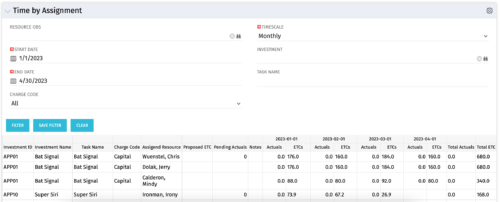 The Time by Assignment portlet displays time logged to assignments for all investments the logged in user has security rights to view - pulling data from the timeslices. It is capable of displaying the data by weekly, monthly or quarterly segments. The portlet may also be filtered by investment and resource OBS.
 -
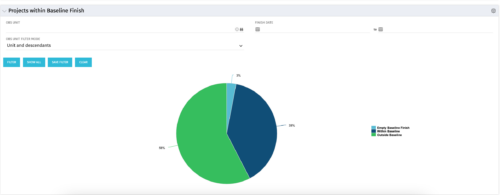 The Projects Within Baseline Finish portlet displays all projects that have a baseline and presents them in a pie chart. This portlet provides management with a way to quickly view the number of projects that are on time. The user may filter by OBS and finish date.
 -
The Projects Within Baseline Finish portlet displays all projects that have a baseline and presents them in a pie chart. This portlet provides management with a way to quickly view the number of projects that are on time. The user may filter by OBS and finish date.
-
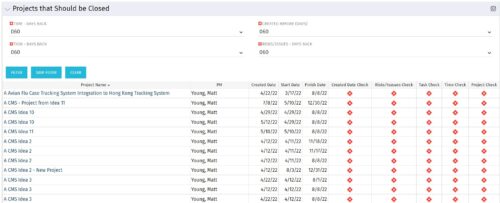
The Projects That Should Be Closed portlet displays all projects that have been created before the specified filter date and has had no new time, tasks, or risks/issues updated after the dates specified in the filter. This can assist in identifying projects that are completed or cancelled and should be closed. The table below describes the available columns in the portlet. Column Label Description Project Name Name of the project PM Manager of the project Created Date Created Date of the project Start Start Date of the project Finish Finish Date of the project Created Date Check Identifies if the project meets the Created Before (Days) filter Risks/Issues Check Identifies if the project meets the Risk/Issues – Days Back filter Task Check Identifies if the project meets the Task – Days Back filter Time Check Identifies if the project meets the Time – Days Back filter Project Check Identifies if the project meets the portlet filter Criteria id Internal code used by the query -
The Projects That Should Be Closed portlet displays all projects that have been created before the specified filter date and has had no new time, tasks, or risks/issues updated after the dates specified in the filter. This can assist in identifying projects that are completed or cancelled and should be closed. The table below describes the available columns in the portlet. Column Label Description Project Name Name of the project PM Manager of the project Created Date Created Date of the project Start Start Date of the project Finish Finish Date of the project Created Date Check Identifies if the project meets the Created Before (Days) filter Risks/Issues Check Identifies if the project meets the Risk/Issues – Days Back filter Task Check Identifies if the project meets the Task – Days Back filter Time Check Identifies if the project meets the Time – Days Back filter Project Check Identifies if the project meets the portlet filter Criteria id Internal code used by the query -
 The Projects Marked for Deletion portlet displays information about projects that are currently pending deletion but excludes templates and programs. This portlet provides an easy way to view all projects that are marked for deletion before the background job actually erases them. The portlet provides all necessary information as well as the project manager in case there are questions about why the project was marked for deletion.
 -
The Projects Marked for Deletion portlet displays information about projects that are currently pending deletion but excludes templates and programs. This portlet provides an easy way to view all projects that are marked for deletion before the background job actually erases them. The portlet provides all necessary information as well as the project manager in case there are questions about why the project was marked for deletion.
-
 The Projects by Stage and Manager portlet displays all active projects (excluding programs), with a project stage and project manager. The portlet color codes the different stages that and counts the number of projects in each stage by project manager. This portlet provides a quick snapshot of all projects with stage details so the PMO may get an overview of where certain projects are sitting with each Project Manager.
 -
The Projects by Stage and Manager portlet displays all active projects (excluding programs), with a project stage and project manager. The portlet color codes the different stages that and counts the number of projects in each stage by project manager. This portlet provides a quick snapshot of all projects with stage details so the PMO may get an overview of where certain projects are sitting with each Project Manager.
-
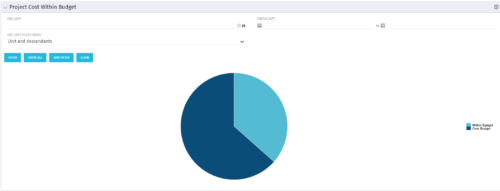 The Project Cost Within Budget portlet shows all projects that are within or exceeding their budgets in a pie chart. The user may filter by OBS and finish dates to narrow the projects. This portlet provides management with a graphical representation of the overall status of cost on all projects.
 -
The Project Cost Within Budget portlet shows all projects that are within or exceeding their budgets in a pie chart. The user may filter by OBS and finish dates to narrow the projects. This portlet provides management with a graphical representation of the overall status of cost on all projects.
-
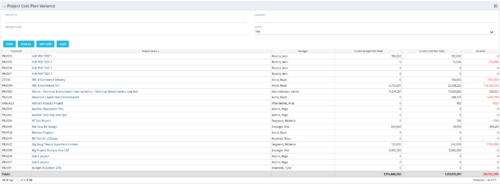 The Project Cost Plan Variance displays the variance between the budget and cost plans for projects the logged in user has security rights to view. The total for the Cost Plan that is marked as the Plan of Record for the project (Current Cost Plan Total), alongside the total for the current approved Budget Plan (Current Budget Plan Total). These two values are then compared in order to generate the total current Variance for the project. A positive amount in the Variance column indicates the project is under budget, while a negative amount indicates the project is over budget. Results may be filtered by: Project ID, Project Name, Manager, and whether the project is Active (Yes, No, All). By default, the portlet will display only Active projects.
 -
The Project Cost Plan Variance displays the variance between the budget and cost plans for projects the logged in user has security rights to view. The total for the Cost Plan that is marked as the Plan of Record for the project (Current Cost Plan Total), alongside the total for the current approved Budget Plan (Current Budget Plan Total). These two values are then compared in order to generate the total current Variance for the project. A positive amount in the Variance column indicates the project is under budget, while a negative amount indicates the project is over budget. Results may be filtered by: Project ID, Project Name, Manager, and whether the project is Active (Yes, No, All). By default, the portlet will display only Active projects.
-
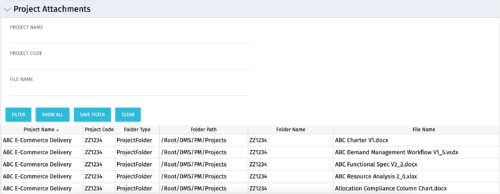 The Project Attachments portlet displays all attachments located on every project, regardless of security rights. This portlet is useful for not only the PM, but also the PMO to determine if a document has been uploaded for the toll gating process. It will also display the folder type, folder path, folder name, and file name. You have the ability to filter by project name, code, file name or file name.
 -
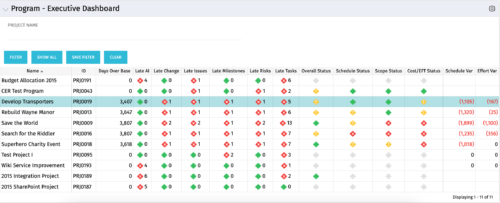 The Program Executive Dashboard portlet displays information regarding sub-projects on a program. It provides a one-stop place for the PMO or management to view all critical information about projects under a specific program. The portlet displays status indicators, dates for late items, variances and days over base, it also displays the project status fields from the Status Report sub-object.


Copyright 2023 • Rego Consulting Corporation • Privacy Policy