-
 The Executive Dashboard portlet displays information regarding projects the user has security rights to view. It provides a one-stop place for the PMO or management to view all critical information about projects. The portlet not only displays status indicators as well as dates for late items, variances and days late, but also displays the project status fields from the Status Report sub-object.
 -
 The Resource Data Issues portlet is used to identify data exceptions related to resource setup. This portlet helps to identify where resources are missing key data or are possibly sitting in an exception state. This view will show resources that have one or many exceptions, including inactive resources. There is no security built into this portlet - all resources will show. The only required field in the filter is Days, which is the number of days since the user last logged in. The user may also narrow the results by resource, OBS, or project type.
 -
 The Capacity Graph portlet displays Availability, Allocations, Actuals and Assignments for a Clarity user in a single view. This portlet pulls data from timeslices, and allows the user to filter on a weekly, monthly or quarterly data. The Estimated Time to Complete (ETC) and Allocation data will only show for projects that are active. This portlet provides a Clarity user with a simple way to analyse their: Allocations vs. Availability, Allocations vs. Actuals, Allocations vs. ETC and ETC vs. Availability. The graph allows the user to determine where areas of improvement may exist and quickly identify potential areas of constraint.
 -
 The Key Tasks & Milestone Status report delivers comprehensive visibility into task and milestone performance through intuitive Start Date and Finish Date visualizations. It consolidates critical execution details, including task status, WBS type, and associated attributes such as project name, project manager, overall project status, and task completion percentage. The report supports dynamic filtering across multiple dimensions, including projects, OBS path, OBS type, task status, and WBS type, enabling targeted analysis and rapid insight. Interactive dashboards facilitate effective tracking, monitoring, and governance of tasks and milestones across the projects.
 -
 The Project Status Detail report provides a comprehensive view of each project’s key elements, including team allocations, major milestones, risks, issues, and change requests. It highlights the most relevant project indicators to give stakeholders a clear understanding of project health and progress. This report supports detailed tracking and review of project performance across multiple dimensions.
 -
 Every chocolate bar starts as a cocoa bean, just like every project starts as an idea. Clarity was designed as the centralized process that transforms raw ideas into beautifully wrapped, ready-to-launch deliverables. It took a partnership across multiple divisions to ensure success!
 -
 Most leaders in this current climate understand the need for more agility, but don't always understand the changes necessary for this. New ways of working require a new mindset and new behaviors. In this session you'll learn about some of the critical mindset and behavioral shifts that are important for leaders as well as what types of conversations need to take place with various stakeholders to put your teams on the path to effective agility.
 -
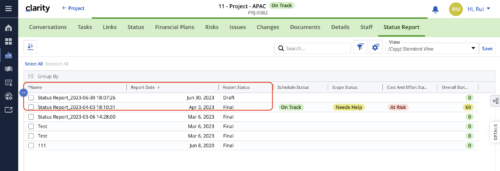 When marking a Status Report 'Final' in a grid/list view, the system doesn't create a new 'Draft' report like it does when using the Status Report UI. For groups that prefer to manage in a grid/list, they need to always have a draft.
 -
 Discover how ApptioOne and Targetprocess seamlessly integrate to combine financial and agile processes, creating a unified approach to managing your organization's technology investments. This session will explore the benefits of leveraging both tools to optimize financial management and enhance agile project delivery. Learn how to harness the power of ApptioOne and Targetprocess together to drive efficiency and achieve your organization's goals.
 -
 Broadcom recently introduced “Cooking with Clarity” a step-by-step guide to deploying and configuring Clarity. This session focuses on how to integrate Clarity and Rally.
 -
 The leadership of your organization plays a vital role in the success of your Agile transformation. It is not always known or understood what role and what specific activities and behaviors are needed by leadership. In this session you will gain some guidance on how to appropriately get your senior leaders on board and ensure they are positioned to support the Agile journey in the most effective manner
 -
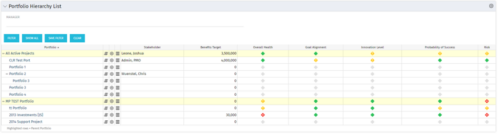 Part of the Business Transformation Package, this portlet displays the portfolios with hierarchy (child portfolio(s)). The portlet displays the basic portfolio fields like – manager, stakeholder, etc. A Metrics subpage can be created with the fields on the “Properties – Metrics.”. The fields: Overall Health, Goal Alignment, Innovation Level, Probability of Success are custom fields and can be configured on a subpage.
 -
 Part of the Business Transformation Content collection, this bar chart portlet displays count of ideas per business unit. This provides a holistic view of the idea pipe-line in an organization providing them a high-level of ideas converted, approved, unapproved per business unit.
 -
 Horizontal Bar Graph displays total number of projects for each Business Owner/Sponsor for a selected Project Parent Stage (only Project Investments included). Vertical Axis displays Business Owner name. Horizontal Axis displays number of projects. Filter selectable for any Project Parent Stage. Color coding of bar and legend are synchronized to detail stage under the parent. Total for each detail stage displays on each segment of the bar. A mouseover displays a percent of total for each detail stage.
 -
 Out of the box, there is no way to export or report on the Modern UX Roadmap Grid view. This report allows the end user to select one or more roadmaps and provides an exportable view of several OOTB fields from those roadmaps. When exported to and open in excel, the first tab will display a combined view of all selected Roadmaps, one row for every Roadmap Item, and additional tabs will display Roadmap-specific views. Custom attributes may be added to the report by your developers.
 -
 This video describes the process review and approve/reject Pending Actuals and ETCs within OWB. The video is available in both .m4v and .wmv formats.
 -
 This video describes the process either a Start or Finish date on a project in OWB. The date (start or finish) will determine the point from which all tasks in the project are then scheduled. The video is available in both .m4v and .wmv formats.
 -
 This video provides an overview of utilizing the various views available within Open WorkBench. The video is available in both .m4v and .wmv formats.
 -
 Part of the Business Transformation collection, this grid portlet displays idea details for all ideas (active and inactive) and all status conditions. This is an editable portlet based on the Ideas data provider. Filterable by OBS structure, Active/Inactive, and Status.
 -
 This training document is a Rego Consulting Quick Reference Guide to assist with the management of Roadmap items within the Grid View in Clarity’s Modern User Experience. This doc references version 16.0.3 views. Instructions are provided to help users add and remove columns, move columns, pin columns and sort rows of data. The document provides guidance on how to use the View Options function to manage Per-Period Metrics. Includes guidance on how to update Roadmap data from the Grid View and how to use the In Plan column to rank investments.
 -
 This training document is a Rego Consulting Quick Reference Guide to assist with General Navigation in Clarity’s Modern User Experience. This doc references version 16.0.3 views. Doc reviews the Menu Bar and User Tool Bar.
 -
 This training document is a Rego Consulting Quick Reference Guide to assist with the adding of resources to the Staff tab for Ideas in Clarity’s Modern User Experience. This doc references version 16.0.2 views. Document provides detail on how to add resources to the Staff tab, Default Allocation % and Per-Period metrics.
 -
 This training document is a Rego Consulting Quick Reference Guide to assist with General Navigation in Clarity’s Modern User Experience. This doc references version 16.0.2 views. Doc reviews the Menu Bar and User Tool Bar.
 -
 A Quick Reference Guide to assist with the creating and managing of Cost Plans in Clarity. The document uses screen shots from the Classic UX using the Phoenix theme.


Copyright 2023 • Rego Consulting Corporation • Privacy Policy