-
 The PM Stalker – Submit Status Report workflow process will email any project manager that has not submitted a status report in the last two weeks. This process will ensure that all status reports are kept up-to-date and provide management with a reliable overview of the status on the project.
 -
 The Grant Project Edit Rights workflow process allows a project manager to grant project edit rights to another user without contacting an administrator. The workflow uses the Out-of-the-box field for Business Owner. The script starts when the field is updated. It will assign project edit rights to whichever user is added to the Business Owner field. This process can be modified to grant project edit rights to any user within a project field.
 -
 The Re-Baseline via Change Request process is a simple method for a member of the project (who has the ability to create change requests) to request a re-baseline of the project without the project manager having to perform it. First, the user must create the change request. The user must then start the process within the change request by using the Processes tab. Once started, the process will route an action item to the Project Manager. If rejected, the process will end and the user must start it again (if needed). If approved, the process will then baseline the project and close out the change request.
 -
 Course Description: How do companies track stage gates within Clarity PPM? This session will review some best practices for tracking, monitoring, and approving stage gates within Clarity PPM. We will also discuss pros and cons of various options to help you select the best method for your company.
 -
 Course Description: Does your company have Office 365, but you’re not sure what it can do for you? This session will cover what Office 365 is, including insights into how Office 365 can help your teams work faster and smarter.
 -
 Learn about the various techniques and emerging methods companies are taking to capitalize Agile work. You'll learn how some companies are moving away from timesheets and using models based on story points and team rates to generate capitalization reporting.
 -

This portlet displays the monthly allocation per resource. The PM can view by the RM or the resource to get the data for monthly resource allocations. The table below describes the available filter fields in the portlet. Column Label Description Work Effort Manager Manager of the Investment the Work Effort is on Work Effort Active Active status of the Investment the Work Effort is on Resource Resource’s Name Internal Resource ID Resource’s ID Zero Allocation Show Allocations that equal zero Open for Time Entry Is the Resource Open for Time Entry Resource Active Resource’s Active status Role Resource’s Primary Role OBS Unit Resource’s OBS Start Allocation Start Time to filter by End Allocation Finish time to filter by -
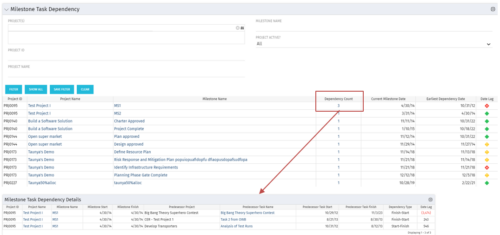 The Milestone Task Dependency portlet shows the milestone task dependency count and has a drilldown to the details. The portlet looks at the dependency impact on milestones, and is not limited to just dependencies that are on different projects. The lag days calculation is based off of the maximum dependency impact and the drilldown portlet (Milestone Task Dependency Details :::: rego_milestone_dependency_det)shows the details for each.
 -
 This portlet will allow administrators or other managers to see what resources have been granted instance rights to any investment. Filtering is available by resource, investment or right.
 -
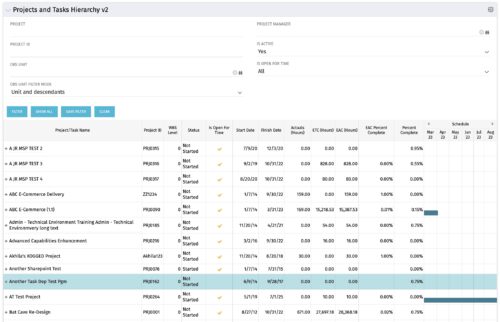 Grid Portlet displays project and task data--including name, dates, status, effort, %Complete, and schedule. Portlet initially displays project data. But there is a + sign toggle, which, when clicked, reveals task data, and the toggle becomes a – sign. User can choose to Automatically Expand all levels from Options Icon>Configure>List Column Section>Options. Portlet supports up to 10 levels of WBS. Portlet filterable by project name and ID, OBS structure, manager name, active/inactive, and open for time entry.
 -
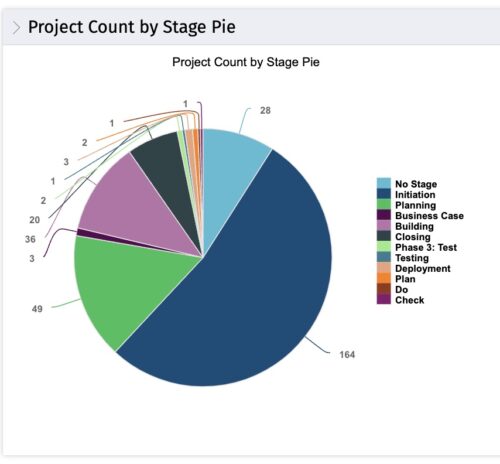 This portlet displays the projects by Stage in a pie chart. Every piece of the pie chart represents a stage of the Project Management methodology applied. The portlet also shows the number of projects on each stage. The legend displays all the different project stages appearing on the portlet. This portlet can be filtered to show only projects from a particular OBS unit or for a particular Project Manager.
 -
 “Resources with No Basic Matrix Entry” portlet displays combinations of project and resource where the assigned resource does or does not have a rate established for that project. Portlet is filterable by Projects, Project ID, Resources, and Missing Rate (Yes, No, All). How does this work? The Rate Matrix Extraction job populates a record into the NBI_PROJ_RES_RATES_AND_COSTS table for every resource/project combination that meets any of the rate matrix criteria. This portlet checks that table, and sets the Missing Rate attribu
 -

 The portlet shows the project spend to vendors by month. The Vendor field picked on the portlet comes from the Vendor mentioned when creating the voucher (as displayed on the first screenshot). This provides a nice view of identifying how much is spent by an organization on the vendor employees on their workforce.
 -
 Part of the Business Transformations collection, this portlet displays planned revenue as defined by a project whose goal is "Grow the business". It uses the Planned Revenue Query as a data provider. This portlet provides a holistic overview of how many projects following the goal “Grow the Business” are Critical/ At Risk / On Track with regard to the planned revenue.
 -
 Part of the Business Transformation collection, this portlet displays count of the planned benefits (savings) per project manager. It also displays if any of the planned benefits are Critical/ At Risk / On Track, along with the total planned benefit amount.
 -
 Part of the Business Transformation collection, this pie chart portlet displays realized benefit, grouped by location of project. This provides the PM with a holistic view of benefits realized across the geographical locations.
 -
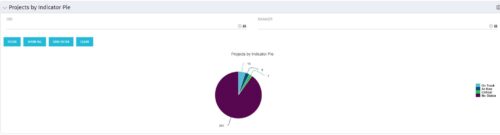 Pie Chart displays counts of all projects by out-of-box Status Indicator attributes. Filterable by OBS structure and Manager. Data label displays count. Mouse-over and Legend display Indicator name. Chart also displays count for projects with no Indicator.
 -
 The Investment Resource Rate portlet allows a user to search for effective (or missing) rates for resources across all investment types. It pulls rate information from the matrix extraction tables and includes currency conversion if the environment supports multiple currencies. The portlet can be used both to search for the rate of any given resource and to determine which resources might be missing rates when an error is generated when attempting to populate a cost plan (REVMGR-20728:Rates and Costs are both missing for one or more roles/resources).
 -
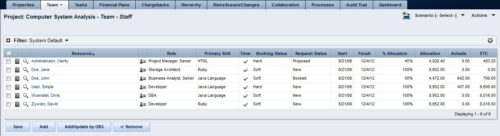
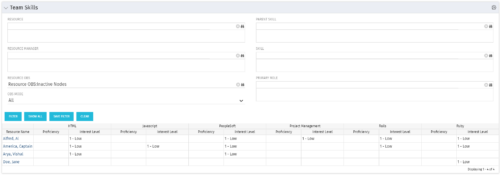 The Team Skills portlet displays Skill Proficiency and Interest Level by Resource. Users can utilize this view to search for Resources by Skill, Parent Skill, Interest, Role, Parent Role, Resource and Resource OBS. This portlet grants a Project Manager or Resource Manager the ability to determine which Resources best fit the needs for their project.
 -
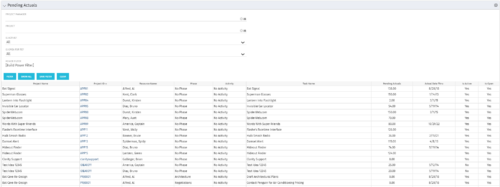 The Pending Actuals portlet displays pending actuals for resources by task. This portlet allows the user to filter on Project, Project Manager, Is Active and Is Open for Time Entry. This portlet provides Resource Managers and Project Managers a simple way to analyse which actuals have been submitted but not posted on specific tasks, as well as the aggregate pending hour total. Note: the information displayed is dependent on what the user has security rights to view.
 -
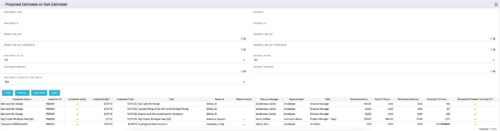 The Proposed Estimates vs. Task Estimates portlet gives the ability to identify when the Proposed Estimates for any given task exceed the Task Estimates. The portlet filters by investment name, investment ID, project OBS unit, investment active (yes/no/all), investment manager, resource name, resource ID, resource OBS unit, resource active (yes/no/all), and resource manager. Additionally, the results can be filtered by the proposed ETC greater than task ETC flag (yes/no/all). The information provided on the portlet includes the investment name, investment ID, investment active (yes/no), investment start/end dates, task name, resource name, resource active (yes/no), resource manager, total hours, total ETC, proposed ETC greater than task ETC flag (yes/no), pending actual hours, and proposed ETC hours.
 -
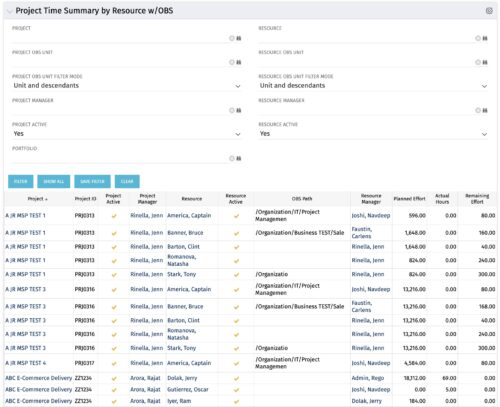 The purpose is to show actual hours, planned effort and remaining effort at the resource level, with the addition of OBS levels to support filtering and manipulation of the exported data.
 -
 The Time By Type - Pie Chart portlet is a graphical representation of time by type of investment for all resources the logged in user has security rights to view. This portlet pulls from the daily timeslices, and can be used for determining what types of projects receive the majority of hours. The filter option allows for entry of a specific start date and finish date.
 -
 PMOs/EPMOs are feeling some pressure from Agile disruptors in their organizations. Some Agile purists insist that they can do everything with an Agile tool and no PMO governance, but this really isn’t the case. If you belong to a PMO or EPMO, this session will help you to better collaborate with your Agile counterparts in finding better and more holistic solutions to value delivery. Tips on how to use Agile principles in your talking points will also be shared.
 -
 The Dashboard: Open Risks portlet gives an overview of all risks that are not closed or resolved for a single project. The portlet will pull the "id" from the page it is placed on, so this portlet is usually placed on the project dashboard tab. The portlet sorts the risks first by priority and then by target date. It displays the name, owner, target date, probability impact, and priority.
 -
 The Dashboard: Open Milestones portlet gives an overview of all milestones that are started or not started for a single project. The portlet will pull the "id" from the page it is placed on, so this portlet is usually placed on the project dashboard tab. The milestones are sorted by Due Date. It displays the name, Due Date, Baseline Date, Days Late (Due Date – Baseline Date), and Days Old (Current Date – Due Date).
 -
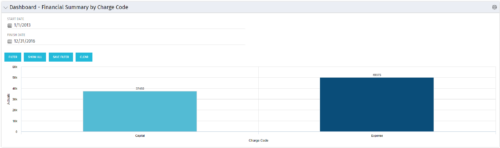 The Dashboard: Financial Summary by Charge Code portlet displays financial information from the project summarized by Charge Code. The portlet is added to the dashboard page of a project and will pull all actuals by charge code on the project. The user may filter by date range to narrow the results.
 -
The Dashboard: Financial Summary by Charge Code portlet displays financial information from the project summarized by Charge Code. The portlet is added to the dashboard page of a project and will pull all actuals by charge code on the project. The user may filter by date range to narrow the results.
-
 This training document is a Rego Consulting Quick Reference Guide to assist with the management of project tasks from within the Tasks tab in Clarity’s Modern User Experience. This doc references version 16.1 views. Document covers Task Tab, Timeline View, Board View, Grid View, adding and removing columns, saving views, task details, To Dos, Assignments, Links, Conversations and View Options settings.
 -
 This training document is a Rego Consulting Quick Reference Guide to assist with the management of Project Tasks via the PPM Gantt view in Clarity’s Modern User Experience. This doc references version 16.1 views. Doc covers PPM Gantt, View Legend, Menu Icons, Create New Task, Indent Tasks, Move Tasks and Set Dependencies.
 -
 This training document is a Rego Consulting Quick Reference Guide to assist with General Navigation in Clarity’s Modern User Experience. This doc references version 16.1 views. Doc reviews the Menu Bar and User Tool Bar.
 -
 The Rego: Transfer Primary Skill process updates the primary skill on the team object by running the process with the execute process job. The process takes the primary skill that is on the resource object and moves it to all of that resource's team records where the primary skill on the team record is null. Utilizing these fields and process provide a quick way to determine what skill each resource is bringing to the project. This process makes the transition seamless from resource primary skill to team primary skill.
 -
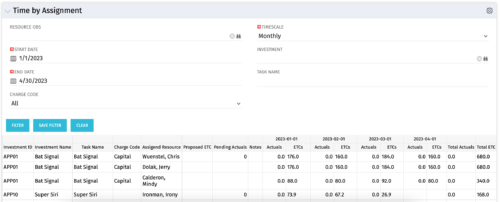 The Time by Assignment portlet displays time logged to assignments for all investments the logged in user has security rights to view - pulling data from the timeslices. It is capable of displaying the data by weekly, monthly or quarterly segments. The portlet may also be filtered by investment and resource OBS.
 -
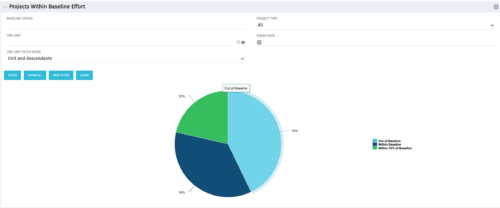 The Projects Within Baseline Effort portlet will display all projects’ baseline effort in a pie chart by three different categories: Out of Baseline, Within Baseline, and Within 10% of Baseline. This portlet is used by the PMO to provide management with a snapshot of all projects and their baselines.
 -
The Projects Within Baseline Effort portlet will display all projects’ baseline effort in a pie chart by three different categories: Out of Baseline, Within Baseline, and Within 10% of Baseline. This portlet is used by the PMO to provide management with a snapshot of all projects and their baselines.
-
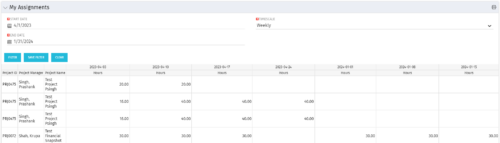 The My Assignments portlet will display the assignments for the logged in user - pulling data from the timeslices. It is used as a quick reference for the users to view their assignments across all of the projects. The portlet also displays work posted against the task, expressed in Actuals, and remaining work to be done, expressed as an Estimate to Complete (ETC). The Effort Variance reflects what the ETC variance is compared to the last current baseline of the project.


Copyright 2023 • Rego Consulting Corporation • Privacy Policy