-
 This session dives into the impact of misaligned data between planning and delivery systems—and what it costs your organization in rework, delays, and missed opportunities. Learn how connecting Clarity and Jira enables real-time synchronization between portfolio planning and Agile execution, giving CIOs the visibility, traceability, and confidence to drive outcomes—not just activity.
 -
 Nudge is a new tool developed by Rego to capture team sentiment in an anonymous, unobtrusive way, using micro surveys through MS Teams.
 -
 This session will align you with best practices for using Clarity's project management functionality. Come and learn about the OOTB capabilities for excellent project management, including: scheduling, assignments, staffing, views, financial plans, and other general project management capabilities. Additionally, tips and tricks will be shared, providing you with a toolkit of ideas for your organization!
 -
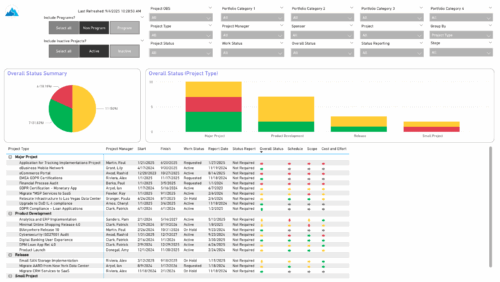 The Project Status Report List provides a consolidated view of project health, including schedule dates, work status, and key status indicators. Users can group results by Portfolio Category, Overall Status, Project Type, Stage, Project Manager, Sponsor, or OBS Level, with the report dynamically adjusting its columns based on the grouping selected. Visuals include an overall status pie chart that shows the percentage of projects by status color, and a column chart that breaks down project counts by status, aligned to the chosen grouping option.
 -
 An engaging, informative session delivered to your organization by a Prosci change management expert. Your leaders, project managers, and others focused on project outcomes will learn how applying change management to projects can increase the likelihood of those projects succeeding. They will also learn about the processes, people and tools needed to align project management and change management.
 -
 This training document is a Rego Consulting Quick Reference Guide to assist with the use of the Links and Conversations functionality in Clarity’s Modern User Experience. This doc references version 16.2.1 views.
 -
This training document is a Rego Consulting Quick Reference Guide to assist with Project creations in Clarity’s Modern User Experience. This doc references version 16.2.1 views. Doc covers create project from project page, create project via the New from Template button, selection of template and project creation from the project tile view.
-
 This training document is a Rego Consulting Quick Reference Guide to assist with Project creations in Clarity’s Modern User Experience. This doc references version 16.1.2 views. Doc covers create project from project page, create project via the New from Template button, selection of template and project creation from the project tile view.
 -
 Learn about the various techniques and emerging methods companies are taking to capitalize Agile work. You'll learn how some companies are moving away from timesheets and using models based on story points and team rates to generate capitalization reporting.
 -
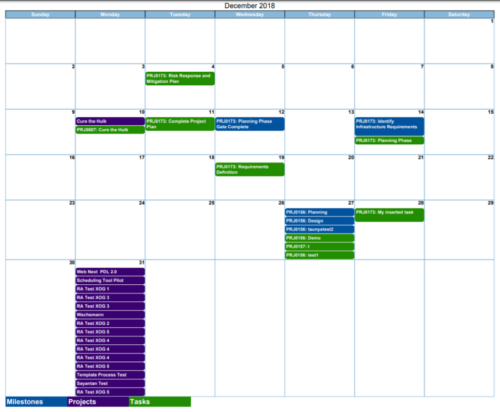
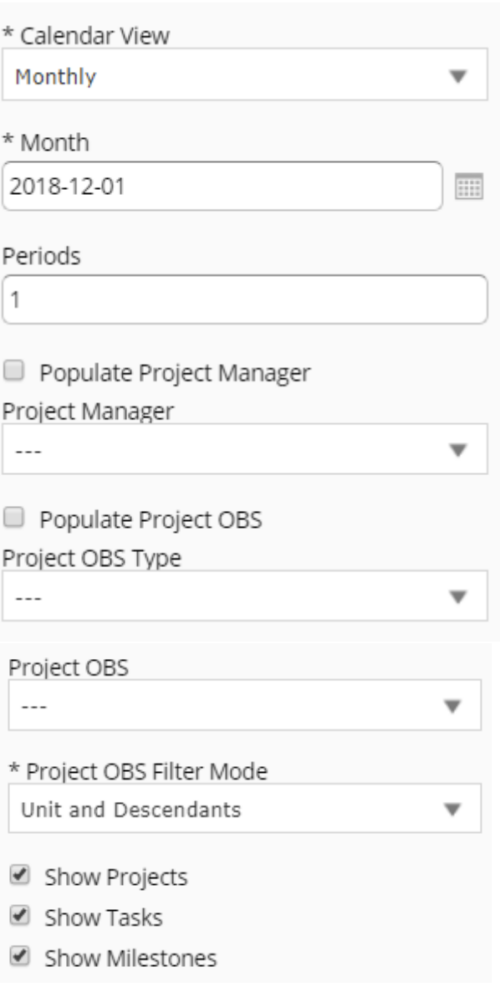 Calendar View report provides a view of Projects, Milestones or Tasks that has finish date within the user selected month. User has the flexibility to choose to Calendar view as Monthly or Weekly and also number of periods that needs to be displayed in the report. Report can be filtered to show only Projects or Milestones or Tasks with the checkboxes provided. It can also be further filtered using Project Manager and Project OBS parameters.
 -
 This portlet shows the project costs by Month. The information displayed includes:
- Start Date for project
- End Date for project
- Budgeted Cost
- Planned Cost
- Actual Hours
-
 This configuration and accompanying process allows users to capture Financial and Non-Financial (Metrics, Soft, etc.) Benefit in a custom sub-object, then programmatically create an out-of-the-box Benefit Plan with just the Financial Portion from the custom sub-object. The solution is comprised of:
- Sub-Object (Benefit Plan Details, Parent = Project)
- Process: Create Benefit Plan (uses sub-object as primary input, native BP is output)
- Process: Update sql - Cost Benefit Plans (one-time script to update Projects)
- Ensure on the Benefit Details List view the Planned and Realized Amounts are displayed
- Modifying the Create Benefit Plan Process in support of a BP naming convention consistent with local PMO Practices
- Modifying the Create Benefit Plan Process to link the BP to the Cost Plan of Record
- Creating a Portlet that pulls together rows of data from the sub-object across multiple projects in a summarized view as well as a detailed view
-
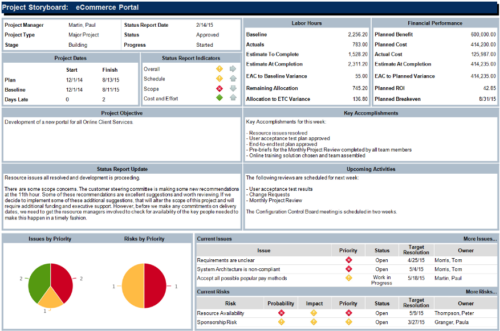 The Project Storyboard report is a transaction based Jaspersoft report that does not require the Load Jaspersoft Datawarehouse job to be run. The report will pull real-time data from the transaction tables in Clarity. This report can be run from either the Advanced Reporting or Reports and Jobs area within Clarity. The Project Storyboard report shows key aspects of a project that is organized in separate frames. Each frame in the report displays project information such as project dates, project objective, the amount, and cost of resources that are planned and actual, key accomplishments, upcoming activities, current issues and risks, and the project progress toward goals. This report can be used to analyze the project earned value and track work performance to account for cost and schedule variances.
 -
 This video describes the process to baseline a project using OWB. The video is available in both .m4v and .wmv formats.
 -
 This video describes the process to assign resources to tasks within OWB. The video is available in both .m4v and .wmv formats.
 -
 This training document is a Rego Consulting Quick Reference Guide to assist with the use of the Staffing Plan in Clarity’s Modern User Experience. This doc references version 16.0.3 views. Document provides information on how to swap between views to see investments by resource or resources by investment. Instructions on filtering are provided, as well as detail on how to update the unit of measure between FTE (Full Time Equivalent) and Hours. Tips are provided on how to expand the list of investments within each view and how to view the properties for the allocations. A Legend is also documented to provide information on each of the icons that are displayed on this page.
 -
 This training document is a Rego Consulting Quick Reference Guide to assist with the creation and editing of Tasks in the Timeline View of Clarity’s Modern User Experience. This doc references version 16.0.3 views. Doc covers how to create a new task in the Timeline View, how to insert sibling or insert child tasks, how to set Milestones, access the Details pane and add resource Assignments. Also details how to move tasks by clicking and dragging within the Timeline View.
 -
 This training document is a Rego Consulting Quick Reference Guide to assist with the creation and editing of Tasks in the Timeline View of Clarity’s Modern User Experience. This doc references version 16.0.2 views. Doc covers how to create a new task in the Timeline View, how to insert sibling or insert child tasks, how to set Milestones, access the Details pane and add resource Assignments. Also details how to move tasks by clicking and dragging within the Timeline View.
 -
 This training document is a Rego Consulting Quick Reference Guide to assist in the replacement of roles with named resources in Clarity’s Modern User Experience. This doc references version 16.0.2 views. Document provides detail on soft bookings, default allocation and requested manager. Instructions are provided on how to access requests from the Staffing Plan view and how to swap the role for a named resource. If requests are not fulfilled in their entirety, details are provided on how the excess allocation is handled.
 -
 This training document is a Rego Consulting Quick Reference Guide to assist with the use of Clarity’s PPM Gantt.
 -
 A Quick Reference Guide to assist in the creation of a Project Status Report in Clarity. The document uses screen shots from the Classic UX with the Phoenix theme.
 -
 Does project and idea estimation take too long and lack visibility? This class will address one of the most common pain points within organizations: how to involve the right people within a timely project estimate. Learn Rego’s model for defining, calculating, and modifying idea and project estimates, so you can increase throughput and ROI.
 -

Rego’s Clarity Adoption Metrics package consists of two sets of metrics: Project metrics, and Resource metrics. Project metrics measure how effectively project managers are using Clarity to manage their projects. Resource metrics measure how effectively resource managers are using Clarity to manage resources. Metrics are scored on a scale of 0 to 5, with higher scores indicating greater adoption and use. All metrics can be viewed numerically or graphically, and can be broken out by OBS. In addition, metric data can display as a 12-month rolling history to help identify trends. Project metrics can also display by lowest / highest adoption rates for a specific resource metric or all resource metrics. There is a variety of way to view the Adoption Metric data, therefore, Rego has made this simple by creating an Adoption Metrics object that contains multiple tabs. Each tab displays one or more of the Project or Resource Adoption Metrics. Based on the nature of the Metrics some tabs will allow the ability to use a pull down menu to select a specific Adoption Metric. There is also a Metrics trending view that pulls monthly snapshots of the metrics. Project metrics consist of the following: - Project Status Reporting – Measures how well PMs create and publish project status reports.
- Project Risk Adoption – Measures how well Risks are being used and managed.
- Project Issue Adoption – Measures how well Issues are being used and managed.
- Project Schedule – Measures how well PMs create tasks and keep the project schedule current.
- Project Baseline – Measures whether or not baselines exist.
- Project Zero ETC’s – Measures how well the PM assigns resources to tasks with ETCs.
- Project Past ETC’s – Measures how many improperly scheduled tasks the PM has.
- Project Milestone / Key Tasks – Measures how well PMs create and manage Milestones / Key Tasks.
- Project Schedule Variance – Measures how effectively PMs manage their schedules.
- Project Effort Variance – Measures how effectively PMs manage their project efforts.
- Project Budget Variance – Measures how effectively PMs manage budgets or cost plans.
- Project Unfilled Roles – Measures project roles with allocations that are already started or starting within the next 30 days.
- Project Data Quality – Measures how effectively PMs complete the Description, Stage, Progress, Objective, and Sponsor/Business Owner fields.
- Project Commitment – Measures the hard allocations for a project over a two week time frame.
- Resource Clarity Usage – Measures how often users log into Clarity.
- Resource Timesheet – Measures if timesheets post in a timely manner.
- Resource Allocation – Measures how well RMs keep total resource allocations within the expected range for future time periods.
- Resource Actualy Utilization – Measures how well Resource allocations match actuals.
- Resource Allocation Date in the Past – Measures how many resources are open for time entry with dates in the past.
- Resource Data Quality – Measures how well RMs complete the Resource Manager and Primary Role fields and optionally the Skill and Employment Type fields.
- Resource Commitment – Measures how much resource available time is committed to projects.
-
 ** No Download - Do not Add to Cart ** Organizational metrics that support any Agile methodology Yes–it's possible. Join our Rego expert guides to learn about industry-proven Agile metrics as well as new ideas to measure success across multiple levels of your value stream Nothing to Download - See link below. http://info.regoconsulting.com/agile-metrics-july-2020


Copyright 2023 • Rego Consulting Corporation • Privacy Policy