-
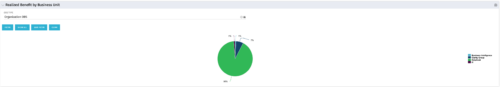 Pie Chart that aggregates Realized Benefit (Total Actual Benefit) by OBS for active projects. Only a Benefit Plan associated with the Cost Plan of Record will return data. The filter allows you to select which OBS filter you prefer to use for this pie chart, however, only an OBS associated with Projects will return data.
 -

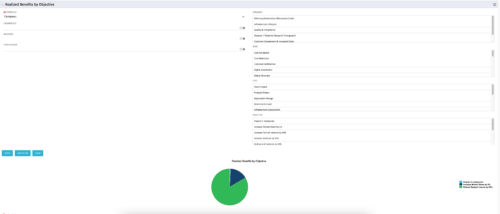 This portlet displays a Pie Chart of a Portfolio’s Realized Benefits partitioned into pie slices by the portfolio’s Investments’ Objectives. Clicking on any pie slice (Objective) drills-down into a portlet that lists the Investments that make up that slice.
 -
 Bar Chart displays average percent variance for all active projects by OBS unit. Percent variance = Planned Cost - Budgeted Cost / Budgeted Cost * 100. Projects with no Budgeted Cost are ignored for the calculation. Then all project variance percentages are algebraically added (some may be negative), and divided by total projects with a variance. This yields the Average Percent Variance. This calculation is performed for active projects in each OBS unit. OBS units include all units at all levels where projects are attached. Portlet filterable by OBS, Financial Status, and Financially Approved. Vertical axis = OBS Unit Name. Horizontal axis = Variance Percent. Data value = Average Percent Variance. Mouseover value = OBS Name + Average Variance Percent.
 -
Bar Chart displays average percent variance for all active projects by OBS unit. Percent variance = Planned Cost - Budgeted Cost / Budgeted Cost * 100. Projects with no Budgeted Cost are ignored for the calculation. Then all project variance percentages are algebraically added (some may be negative), and divided by total projects with a variance. This yields the Average Percent Variance. This calculation is performed for active projects in each OBS unit. OBS units include all units at all levels where projects are attached. Portlet filterable by OBS, Financial Status, and Financially Approved. Vertical axis = OBS Unit Name. Horizontal axis = Variance Percent. Data value = Average Percent Variance. Mouseover value = OBS Name + Average Variance Percent.
-
 Part of the Business Transformation collection, this bar-chart portlet displays number of investments per stage. This provides a holistic overview of where the projects are within the organization.
 -
Part of the Business Transformation collection, this bar-chart portlet displays number of investments per stage. This provides a holistic overview of where the projects are within the organization.
-
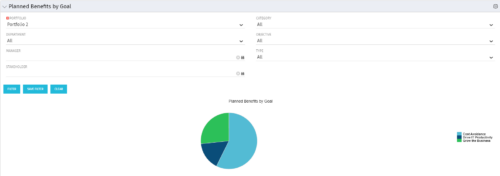 Part of the Business Transformation Package, this pie chart portlet shows planned benefits across the system grouped by Goal. The data is displayed form the investments in a portfolio. The portlet lets the Portfolio Manager know on which GOAL the planned benefit is allocated, so as to target the overall investment spread in the portfolio.
 -
Part of the Business Transformation Package, this pie chart portlet shows planned benefits across the system grouped by Goal. The data is displayed form the investments in a portfolio. The portlet lets the Portfolio Manager know on which GOAL the planned benefit is allocated, so as to target the overall investment spread in the portfolio.
-
 This portlet shows the variance between the budgeted cost and the planned cost for projects. This allows for the variance to be displayed between what was planned and what was approved. This provides the PMs with the ability to better plan the costs.
 -
 The portlet shows the Overall Status and Budget Status and Amounts. It displays one row per project. The portlet shows the following main fields: Overall Status, Budget Status, Capital Budget, Operating Budget, Total Budget, Capital Planed, Operating Planned, Total Planned, Capital Actuals, Operating Actuals, Total Actuals, Budget Variance ($), Budget Variance (%) Displaying the budget variance allows the PM to understand of the project is over / under spent, and thus the costs planning needs to be re-visited.
 -
The portlet shows the Overall Status and Budget Status and Amounts. It displays one row per project. The portlet shows the following main fields: Overall Status, Budget Status, Capital Budget, Operating Budget, Total Budget, Capital Planed, Operating Planned, Total Planned, Capital Actuals, Operating Actuals, Total Actuals, Budget Variance ($), Budget Variance (%) Displaying the budget variance allows the PM to understand of the project is over / under spent, and thus the costs planning needs to be re-visited.
-
 Part of the Business Transformations collection, this portlet displays planned revenue as defined by a project whose goal is "Grow the business". It uses the Planned Revenue Query as a data provider. This portlet provides a holistic overview of how many projects following the goal “Grow the Business” are Critical/ At Risk / On Track with regard to the planned revenue.
 -
Part of the Business Transformations collection, this portlet displays planned revenue as defined by a project whose goal is "Grow the business". It uses the Planned Revenue Query as a data provider. This portlet provides a holistic overview of how many projects following the goal “Grow the Business” are Critical/ At Risk / On Track with regard to the planned revenue.
-
 Part of the Business Transformation collection, this portlet displays count of the planned benefits (savings) per project manager. It also displays if any of the planned benefits are Critical/ At Risk / On Track, along with the total planned benefit amount.
 -
Part of the Business Transformation collection, this portlet displays count of the planned benefits (savings) per project manager. It also displays if any of the planned benefits are Critical/ At Risk / On Track, along with the total planned benefit amount.
-
 Part of the Business Transformation collection, this pie chart portlet displays realized benefit, grouped by location of project. This provides the PM with a holistic view of benefits realized across the geographical locations.
 -
Part of the Business Transformation collection, this pie chart portlet displays realized benefit, grouped by location of project. This provides the PM with a holistic view of benefits realized across the geographical locations.
-
 Part of the Business Transformation collection, this line chart portlet displays realized vs planned benefits overtime, for portfolio investments. This provides the PfM with a holistic view of benefits planned vs realized over a period of time.
 -
Part of the Business Transformation collection, this line chart portlet displays realized vs planned benefits overtime, for portfolio investments. This provides the PfM with a holistic view of benefits planned vs realized over a period of time.
-
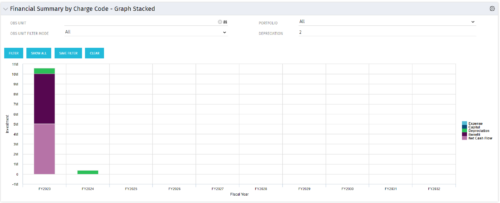 The Financial Summary by Charge Code – Graph Stacked portlet displays yearly charge code financial information across all projects in a stacked bar graph. This portlet provides management with a snapshot of all projects’ financial information totaled and sorted by expense, capital, depreciation, benefit, and net cash flow. The depreciation is calculated based on a straight-line method. The user may filter on OBS unit and/or portfolio to narrow down the search results.
 -
The Financial Summary by Charge Code – Graph Stacked portlet displays yearly charge code financial information across all projects in a stacked bar graph. This portlet provides management with a snapshot of all projects’ financial information totaled and sorted by expense, capital, depreciation, benefit, and net cash flow. The depreciation is calculated based on a straight-line method. The user may filter on OBS unit and/or portfolio to narrow down the search results.
-
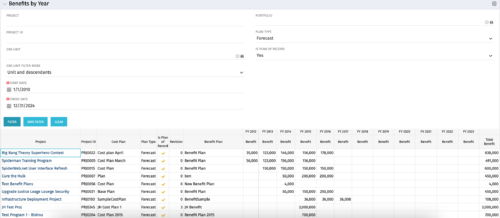 The Benefits by Year portlet summarizes Benefit totals by year and is searchable by Project, OBS and Portfolio. The results display both Budgeted Benefit Plans and Forecast Plans and the associated Cost Plan. Users can make use of this portlet to view Benefit Plan totals across an OBS or Portfolio or to compare the Budgeted Benefit of a Project versus the current plan.
 -
 The Hours and Cost by Vendor – Grid portlet displays vendor hour or costs by month grouped by vendor. Using this portlet, management is provided with a quick overview of vendor costs or hours by month for a set of time without running a report or navigating to each resource individually. This portlet uses the monthly actual timeslices. The user may filter by vendor, vendor ID, date, and hours/cost in addition to the start/finish and hours/cost. Once populated, the grid will display all vendors that currently have hours/cost for the selected time frame.
 -
The Hours and Cost by Vendor – Grid portlet displays vendor hour or costs by month grouped by vendor. Using this portlet, management is provided with a quick overview of vendor costs or hours by month for a set of time without running a report or navigating to each resource individually. This portlet uses the monthly actual timeslices. The user may filter by vendor, vendor ID, date, and hours/cost in addition to the start/finish and hours/cost. Once populated, the grid will display all vendors that currently have hours/cost for the selected time frame.
-
 The Hours and Cost by Vendor - Graph portlet displays vendor hour or costs by month. Using this portlet, management is provided with a graphical representation of vendor costs or hours by month for a set of time without running a report or navigating to each resource individually. This portlet uses the monthly actual timeslices. Additionally, the user must select a date range and whether to display hours or costs. Once populated, the graph will display all vendors that currently have hours and cost for the selected date range.
 -
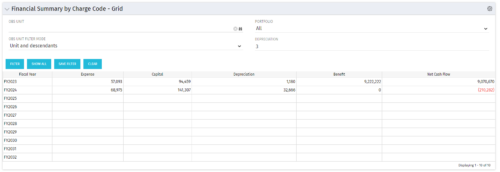 The Financial Summary by Charge Code – Grid portlet displays yearly charge code financial information across all projects. This portlet provides management with a snapshot of all projects’ financial information totaled and sorted by expense, capital, depreciation, benefit, and net cash flow. The depreciation is calculated based on a straight-line method. The user may filter on OBS unit and/or portfolio to narrow down the search results.
 -
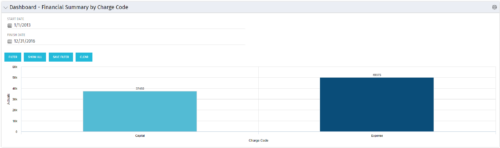 The Dashboard: Financial Summary by Charge Code portlet displays financial information from the project summarized by Charge Code. The portlet is added to the dashboard page of a project and will pull all actuals by charge code on the project. The user may filter by date range to narrow the results.
 -
 This training document is a Rego Consulting Quick Reference Guide to assist with the management of project Financials in Clarity’s Modern User Experience. This doc references version 16.1 views. Document includes summary information on the Financials module and provides detail on how to customize the grid and save views. Instructions are provided on how to filter data and how to use the ⋮ (vertical ellipses) icon to access further features. Detail is provided on the group by function, the column panel, the export of cost plan and editing cost plan and budget plan data from the grid.
 -
 This training document is a Rego Consulting Quick Reference Guide to assist with Financial Actuals and Reporting in Clarity’s Modern User Experience. This doc references version 16.1 views. Document includes detail on which jobs should be run to ensure project and financial data is synchronized with the latest posted actuals. Information is provided on how to analyze cost plans and how to review actual transactions. Instructions are provided on how to analyze budget plans.
 -
 This training document is a Rego Consulting Quick Reference Guide to assist with the entering of financial transactions in Clarity’s Classic User Experience. This doc references version 16.1 views. Document provides basic information on the definition of a transaction and the composition of transaction items. Detail is provided on how to create a new transaction from the Transaction Entry page of the Classic User Experience. Information is provided on how to enter detail into each individual line item for a transaction.
 -
 This training document is a Rego Consulting Quick Reference Guide to assist with the creation of Cost Plans in Clarity’s Modern User Experience. Instructions are provided on how to access Cost Plans from the Financials tab and how to create a new Cost Plan. Detail is provided on how to create a cost plan with project information (Populate from Allocations and Populate from Assignments), how to manually enter data into a cost plan and how to set a cost plan as the Plan of Record.
 -
 This training document is a Rego Consulting Quick Reference Guide to assist with the management of Budget Plans in Clarity’s Modern User Experience. This doc references version 16.1 views. Doc provides detail on how to submit a cost plan for approval, how to approve or reject submitted budgets and also provides additional detail on the rules that apply to the submission of budget plans.


Copyright 2023 • Rego Consulting Corporation • Privacy Policy