-
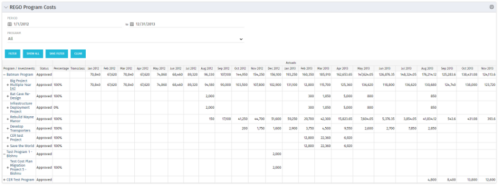 The Program Costs portlet looks like a cost plan. It will summarize all cost plans from projects within the program and display the totals.
 -
 This portlet shows the project costs by Month. The information displayed includes:
- Start Date for project
- End Date for project
- Budgeted Cost
- Planned Cost
- Actual Hours
-
This portlet shows the project costs by Month. The information displayed includes:
- Start Date for project
- End Date for project
- Budgeted Cost
- Planned Cost
- Actual Hours
-
This portlet shows the project costs by Month. The information displayed includes:
- Start Date for project
- End Date for project
- Budgeted Cost
- Planned Cost
- Actual Hours
-
 Project Budget vs Planned vs Actual by Month report provides the Project Managers a single place to view Project Budget, Planned and Actual Cost for multiple projects. Project Managers can use this view to compare various costs for that project in a particular month. User can further narrow their search by OBS Type & Path, Is Project Active?, Fiscal Month Start Date, Investment Manager and Investment Name.
 -
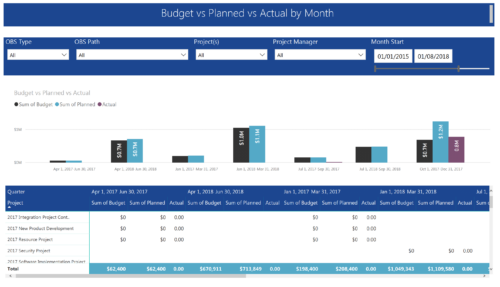 Project Budget vs Planned vs Actual by Month report provides the Project Managers a single place to view Project Budget, Planned and Actual Cost for multiple projects. This report displays Project Budget vs Planned vs Actual by Month in the form of clustered bar chart over a period of time. User can further drill down the information to investment level by selecting a particular bar within the chart. User can further narrow their search by OBS Type & Path, Project(s), Project Manager, Month Start and End Date.
 -
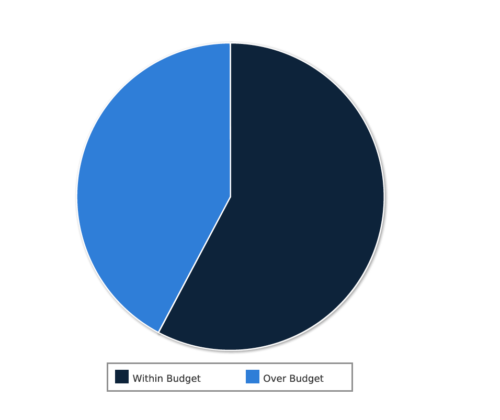 Project Cost within Budget report displays count of projects that are within or exceeding budget in the form of a pie chart. This report provides management a graphical representation of cost status on all projects. Mouse over on the pie chart displays count of projects for that category. You can further narrow your search by OBS Type & Path, Project Manager, Project Status, Project Stage, Program Name, Is project Active? And Is Template?.
 -
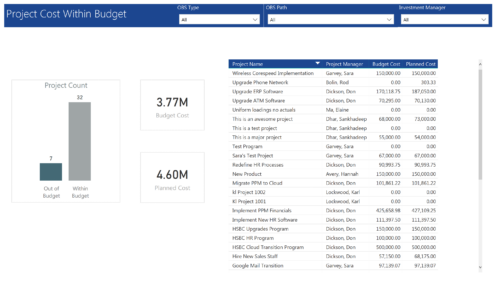 Project Cost within Budget report displays count of projects that are within or exceeding budget in the form of a bar chart. It also displays Total budget cost and Planned cost. User can further drill down the details to investment level. You can further narrow your search by OBS Type & Path and Investment Manager.
 -

 The portlet shows the project spend to vendors by month. The Vendor field picked on the portlet comes from the Vendor mentioned when creating the voucher (as displayed on the first screenshot). This provides a nice view of identifying how much is spent by an organization on the vendor employees on their workforce.
 -
The portlet shows the project spend to vendors by month. The Vendor field picked on the portlet comes from the Vendor mentioned when creating the voucher (as displayed on the first screenshot). This provides a nice view of identifying how much is spent by an organization on the vendor employees on their workforce.
-
 Part of the Business Transformation collection, this bar-chart portlet displays number of investments per stage. This provides a holistic overview of where the projects are within the organization.
 -
Part of the Business Transformation collection, this bar-chart portlet displays number of investments per stage. This provides a holistic overview of where the projects are within the organization.
-
Part of the Business Transformation collection, this bar-chart portlet displays number of investments per stage. This provides a holistic overview of where the projects are within the organization.
-
 Does project and idea estimation take too long and lack visibility? This class will address one of the most common pain points within organizations: how to involve the right people within a timely project estimate. Learn Rego’s model for defining, calculating, and modifying idea and project estimates, so you can increase throughput and ROI.
 -

- ITFM Introduction
- PMO & IT Finance Collaboration
- Where ITFM and PPM Meet
- Connecting PPM with ITFM
-
 A Quick Reference guide to assist in the creation and management of project cost and budget plans in Clarity’s Modern UX. Reviews the access of project details from the Project Grid or Tile views, creation of a cost and budget plan, and edits to those plans.
 -
 This training document is a Rego Consulting Quick Reference Guide to assist with accessing Project Financials in Clarity’s Modern User Experience.
 -
 A Quick Reference Guide to assist with the creating and managing of Cost Plans in Clarity. The document uses screen shots from the Classic UX using the Phoenix theme.
 -
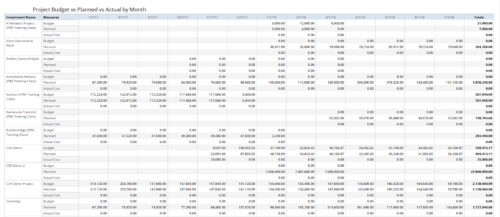
 The portlet shows the Overall Status and Budget Status and Amounts. It displays one row per project. The portlet shows the following main fields: Overall Status, Budget Status, Capital Budget, Operating Budget, Total Budget, Capital Planed, Operating Planned, Total Planned, Capital Actuals, Operating Actuals, Total Actuals, Budget Variance ($), Budget Variance (%) Displaying the budget variance allows the PM to understand of the project is over / under spent, and thus the costs planning needs to be re-visited.
 -
The portlet shows the Overall Status and Budget Status and Amounts. It displays one row per project. The portlet shows the following main fields: Overall Status, Budget Status, Capital Budget, Operating Budget, Total Budget, Capital Planed, Operating Planned, Total Planned, Capital Actuals, Operating Actuals, Total Actuals, Budget Variance ($), Budget Variance (%) Displaying the budget variance allows the PM to understand of the project is over / under spent, and thus the costs planning needs to be re-visited.
-
 Project Status and Costs report gives the Project Manager a single place to view various Project Statuses ( Cost and Effort, Schedule, Scope and Overall ) and Costs ( Planned, Budget & Actuals ) for multiple projects. User can further narrow their search by OBS Type & Path, Project Name, Project Manager and Is Project Active?.
 -
 This training document is a Rego Consulting Quick Reference Guide to assist with the creation of Benefit Plans in Clarity’s Modern User Experience. This doc references version 16.0.2 views. Doc provides detail on how to create a Benefit Plan, how to categorize Benefit Class and Benefit Subclass, how to add financial values to your Benefit Plan, and how to add the Benefit Plan to your Cost Plan.


Copyright 2023 • Rego Consulting Corporation • Privacy Policy