-
 Part of the Business Transformation collection, this bar-chart portlet displays number of investments per stage. This provides a holistic overview of where the projects are within the organization.
 -
Part of the Business Transformation collection, this bar-chart portlet displays number of investments per stage. This provides a holistic overview of where the projects are within the organization.
-
 This portlet will allow administrators or other managers to see what resources have been granted instance rights to any investment. Filtering is available by resource, investment or right.
 -
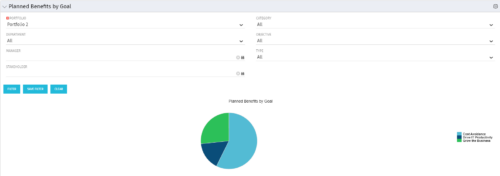 Part of the Business Transformation Package, this pie chart portlet shows planned benefits across the system grouped by Goal. The data is displayed form the investments in a portfolio. The portlet lets the Portfolio Manager know on which GOAL the planned benefit is allocated, so as to target the overall investment spread in the portfolio.
 -
Part of the Business Transformation Package, this pie chart portlet shows planned benefits across the system grouped by Goal. The data is displayed form the investments in a portfolio. The portlet lets the Portfolio Manager know on which GOAL the planned benefit is allocated, so as to target the overall investment spread in the portfolio.
-
 This portlet shows the variance between the budgeted cost and the planned cost for projects. This allows for the variance to be displayed between what was planned and what was approved. This provides the PMs with the ability to better plan the costs.
 -
This portlet shows the variance between the budgeted cost and the planned cost for projects. This allows for the variance to be displayed between what was planned and what was approved. This provides the PMs with the ability to better plan the costs.
-
This portlet shows the variance between the budgeted cost and the planned cost for projects. This allows for the variance to be displayed between what was planned and what was approved. This provides the PMs with the ability to better plan the costs.
-
 “Resources with No Basic Matrix Entry” portlet displays combinations of project and resource where the assigned resource does or does not have a rate established for that project. Portlet is filterable by Projects, Project ID, Resources, and Missing Rate (Yes, No, All). How does this work? The Rate Matrix Extraction job populates a record into the NBI_PROJ_RES_RATES_AND_COSTS table for every resource/project combination that meets any of the rate matrix criteria. This portlet checks that table, and sets the Missing Rate attribu
 -
“Resources with No Basic Matrix Entry” portlet displays combinations of project and resource where the assigned resource does or does not have a rate established for that project. Portlet is filterable by Projects, Project ID, Resources, and Missing Rate (Yes, No, All). How does this work? The Rate Matrix Extraction job populates a record into the NBI_PROJ_RES_RATES_AND_COSTS table for every resource/project combination that meets any of the rate matrix criteria. This portlet checks that table, and sets the Missing Rate attribu
-

 The portlet shows the project spend to vendors by month. The Vendor field picked on the portlet comes from the Vendor mentioned when creating the voucher (as displayed on the first screenshot). This provides a nice view of identifying how much is spent by an organization on the vendor employees on their workforce.
 -
The portlet shows the project spend to vendors by month. The Vendor field picked on the portlet comes from the Vendor mentioned when creating the voucher (as displayed on the first screenshot). This provides a nice view of identifying how much is spent by an organization on the vendor employees on their workforce.
-
 The portlet shows the Overall Status and Budget Status and Amounts. It displays one row per project. The portlet shows the following main fields: Overall Status, Budget Status, Capital Budget, Operating Budget, Total Budget, Capital Planed, Operating Planned, Total Planned, Capital Actuals, Operating Actuals, Total Actuals, Budget Variance ($), Budget Variance (%) Displaying the budget variance allows the PM to understand of the project is over / under spent, and thus the costs planning needs to be re-visited.
 -
The portlet shows the Overall Status and Budget Status and Amounts. It displays one row per project. The portlet shows the following main fields: Overall Status, Budget Status, Capital Budget, Operating Budget, Total Budget, Capital Planed, Operating Planned, Total Planned, Capital Actuals, Operating Actuals, Total Actuals, Budget Variance ($), Budget Variance (%) Displaying the budget variance allows the PM to understand of the project is over / under spent, and thus the costs planning needs to be re-visited.
-
 Part of the Business Transformations collection, this portlet displays planned revenue as defined by a project whose goal is "Grow the business". It uses the Planned Revenue Query as a data provider. This portlet provides a holistic overview of how many projects following the goal “Grow the Business” are Critical/ At Risk / On Track with regard to the planned revenue.
 -
Part of the Business Transformations collection, this portlet displays planned revenue as defined by a project whose goal is "Grow the business". It uses the Planned Revenue Query as a data provider. This portlet provides a holistic overview of how many projects following the goal “Grow the Business” are Critical/ At Risk / On Track with regard to the planned revenue.
-
 Part of the Business Transformation collection, this portlet displays count of the planned benefits (savings) per project manager. It also displays if any of the planned benefits are Critical/ At Risk / On Track, along with the total planned benefit amount.
 -
Part of the Business Transformation collection, this portlet displays count of the planned benefits (savings) per project manager. It also displays if any of the planned benefits are Critical/ At Risk / On Track, along with the total planned benefit amount.
-
Part of the Business Transformation collection, this portlet displays count of the planned benefits (savings) per project manager. It also displays if any of the planned benefits are Critical/ At Risk / On Track, along with the total planned benefit amount.
-
 Part of the Business Transformation collection, this pie chart portlet displays realized benefit, grouped by location of project. This provides the PM with a holistic view of benefits realized across the geographical locations.
 -
Part of the Business Transformation collection, this pie chart portlet displays realized benefit, grouped by location of project. This provides the PM with a holistic view of benefits realized across the geographical locations.
-
Part of the Business Transformation collection, this pie chart portlet displays realized benefit, grouped by location of project. This provides the PM with a holistic view of benefits realized across the geographical locations.
-
 Part of the Business Transformation collection, this line chart portlet displays realized vs planned benefits overtime, for portfolio investments. This provides the PfM with a holistic view of benefits planned vs realized over a period of time.
 -
Part of the Business Transformation collection, this line chart portlet displays realized vs planned benefits overtime, for portfolio investments. This provides the PfM with a holistic view of benefits planned vs realized over a period of time.
-
Part of the Business Transformation collection, this line chart portlet displays realized vs planned benefits overtime, for portfolio investments. This provides the PfM with a holistic view of benefits planned vs realized over a period of time.
-
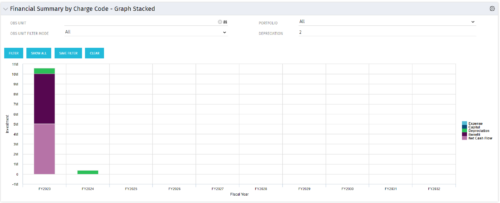 The Financial Summary by Charge Code – Graph Stacked portlet displays yearly charge code financial information across all projects in a stacked bar graph. This portlet provides management with a snapshot of all projects’ financial information totaled and sorted by expense, capital, depreciation, benefit, and net cash flow. The depreciation is calculated based on a straight-line method. The user may filter on OBS unit and/or portfolio to narrow down the search results.
 -
The Financial Summary by Charge Code – Graph Stacked portlet displays yearly charge code financial information across all projects in a stacked bar graph. This portlet provides management with a snapshot of all projects’ financial information totaled and sorted by expense, capital, depreciation, benefit, and net cash flow. The depreciation is calculated based on a straight-line method. The user may filter on OBS unit and/or portfolio to narrow down the search results.
-
 The Investment Resource Rate portlet allows a user to search for effective (or missing) rates for resources across all investment types. It pulls rate information from the matrix extraction tables and includes currency conversion if the environment supports multiple currencies. The portlet can be used both to search for the rate of any given resource and to determine which resources might be missing rates when an error is generated when attempting to populate a cost plan (REVMGR-20728:Rates and Costs are both missing for one or more roles/resources).
 -
The Investment Resource Rate portlet allows a user to search for effective (or missing) rates for resources across all investment types. It pulls rate information from the matrix extraction tables and includes currency conversion if the environment supports multiple currencies. The portlet can be used both to search for the rate of any given resource and to determine which resources might be missing rates when an error is generated when attempting to populate a cost plan (REVMGR-20728:Rates and Costs are both missing for one or more roles/resources).
-
The Investment Resource Rate portlet allows a user to search for effective (or missing) rates for resources across all investment types. It pulls rate information from the matrix extraction tables and includes currency conversion if the environment supports multiple currencies. The portlet can be used both to search for the rate of any given resource and to determine which resources might be missing rates when an error is generated when attempting to populate a cost plan (REVMGR-20728:Rates and Costs are both missing for one or more roles/resources).


Copyright 2023 • Rego Consulting Corporation • Privacy Policy